
用Python可视化RDFLIB图
用Python可视化RDFLIB图
提问于 2016-09-01 14:25:15
我对python的RDFLIB很陌生。我在这里找到了一个创建图形的例子。由这段代码创建的图形可视化最简单的方法是什么?
import rdflib
# Now we create a graph, a representaiton of the ontology
g = rdflib.Graph()

# Now define the key words that we will use (the edge weights of the graph)
has_border_with = rdflib.URIRef('http://www.example.org/has_border_with')
located_in = rdflib.URIRef('http://www.example.org/located_in')

# define the things - base level objects that will be the nodes
# In this case first we have countries
germany = rdflib.URIRef('http://www.example.org/country1')
france = rdflib.URIRef('http://www.example.org/country2')
china = rdflib.URIRef('http://www.example.org/country3')
mongolia = rdflib.URIRef('http://www.example.org/country4')

# then we have continents
europa = rdflib.URIRef('http://www.example.org/part1')
asia = rdflib.URIRef('http://www.example.org/part2')

# Having defined the things and the edge weights, now assemble the graph
g.add((germany,has_border_with,france))
g.add((china,has_border_with,mongolia))
g.add((germany,located_in,europa))
g.add((france,located_in,europa))
g.add((china,located_in,asia))
g.add((mongolia,located_in,asia))
我看到rdflib包有一个工具组件,它有一个名为rdfs2dot的函数。如何使用此函数显示带有RDF图的绘图?
回答 2
Stack Overflow用户
回答已采纳
发布于 2019-01-08 15:49:32
在这个问题中使用提示:converter
我能够通过转换到Networkx图并使用Networkx/Matplotlib绘图工具来绘制RDF图。
import rdflib
from rdflib.extras.external_graph_libs import rdflib_to_networkx_multidigraph
import networkx as nx
import matplotlib.pyplot as plt

url = 'https://www.w3.org/TeamSubmission/turtle/tests/test-30.ttl'

g = rdflib.Graph()
result = g.parse(url, format='turtle')

G = rdflib_to_networkx_multidigraph(result)

# Plot Networkx instance of RDF Graph
pos = nx.spring_layout(G, scale=2)
edge_labels = nx.get_edge_attributes(G, 'r')
nx.draw_networkx_edge_labels(G, pos, edge_labels=edge_labels)
nx.draw(G, with_labels=True)

#if not in interactive mode for
plt.show()
要可视化大型RDF图,样式可能需要一些细化;-)
Stack Overflow用户
发布于 2020-04-28 15:28:28
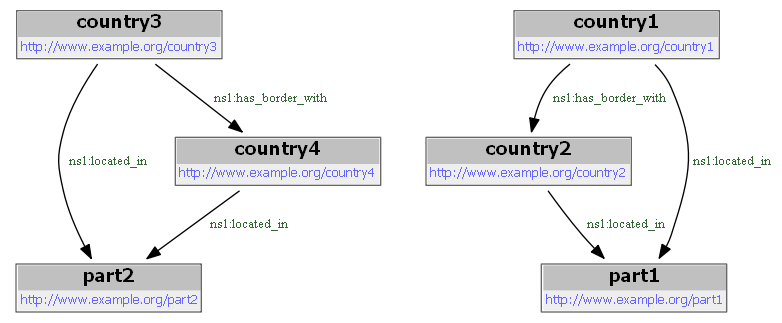
我可以像您建议的那样,用rdf2dot为您的RDF图绘制一张图片。尽管如此,我对这个库并不完全满意,因为它没有为文字做任何节点。这是我的密码:
!pip install pydotplus
!pip install graphviz

import io
import pydotplus
from IPython.display import display, Image
from rdflib.tools.rdf2dot import rdf2dot

def visualize(g):
    stream = io.StringIO()
    rdf2dot(g, stream, opts = {display})
    dg = pydotplus.graph_from_dot_data(stream.getvalue())
    png = dg.create_png()
    display(Image(png))

visualize(g)
给出了以下结果:
页面原文内容由Stack Overflow提供。腾讯云小微IT领域专用引擎提供翻译支持
原文链接:
https://stackoverflow.com/questions/39274216
复制相关文章
相似问题
腾讯云开发者

Copyright © 2013 - 2026 Tencent Cloud. All Rights Reserved. 腾讯云 版权所有
深圳市腾讯计算机系统有限公司 ICP备案/许可证号:粤B2-20090059 ![]() 粤公网安备44030502008569号
粤公网安备44030502008569号
腾讯云计算(北京)有限责任公司 京ICP证150476号 | 京ICP备11018762号