
如何使用ChartJS创建堆叠图
如何使用ChartJS创建堆叠图
提问于 2016-08-24 15:45:25
到目前为止,我已经成功地使用ChartJS创建了一个线条图。但我想把它做成叠加图。
以下是我到目前为止所拥有的:
define(['backbone'], function(Backbone)
{
var fifthSubViewModel = Backbone.View.extend(
{
template: _.template($('#myChart5-template').html()),
render: function(){
$(this.el).html(this.template());
var ctx = this.$el.find('#lineChart5')[0];
var lineChart = new Chart(ctx, {
type: 'line',
data: {
labels: ["Jan", "Feb", "Mar", "Apr", "May", "Jun", "Jul", "Aug", "Sep", "Oct", "Nov", "Dec"],
datasets: [{
label: "Unavailable Unit",
backgroundColor: "rgba(38, 185, 154, 0.31)",
borderColor: "rgba(38, 185, 154, 0.7)",
pointBorderColor: "rgba(38, 185, 154, 0.7)",
pointBackgroundColor: "rgba(38, 185, 154, 0.7)",
pointHoverBackgroundColor: "#fff",
pointHoverBorderColor: "rgba(220,220,220,1)",
pointBorderWidth: 1,
data: this.model.attributes.unavailThisYear
}, {
label: "Vacant Unit",
backgroundColor: "rgba(3, 88, 106, 0.3)",
borderColor: "rgba(3, 88, 106, 0.70)",
pointBorderColor: "rgba(3, 88, 106, 0.70)",
pointBackgroundColor: "rgba(3, 88, 106, 0.70)",
pointHoverBackgroundColor: "#fff",
pointHoverBorderColor: "rgba(151,187,205,1)",
pointBorderWidth: 1,
data: this.model.attributes.vacThisYear
}]
},
options: {
scales: {
yAxes: [{
scaleLabel: {
display: true,
labelString: 'Income in $'
}
}]
}
}
});
},
initialize: function(){
console.log("In the initialize function");
this.listenTo(this.model, 'change', this.render);
this.listenTo(this.model, 'destroy', this.remove);
this.render();
}
});
return fifthSubViewModel;
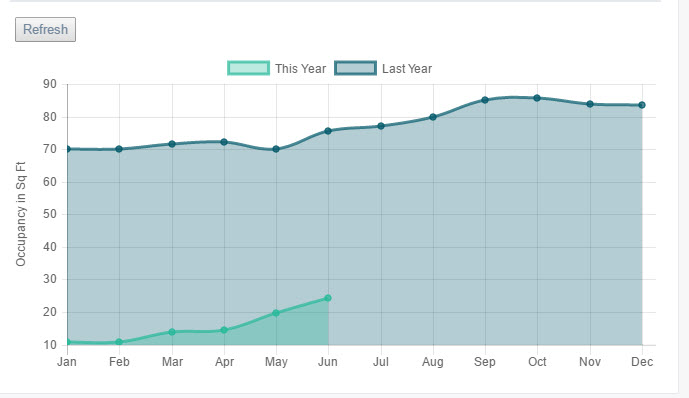
});目前,我在一个图表上得到两条线图。但我总想把它们堆起来。我的意思是,第二行图的起点应该是从第一行图开始的地方。因此,这一地区不应重叠。有什么办法,我可以告诉我的线图,从另一个线图结束的值开始,以得到一个叠加的图表。
当前屏幕未堆叠:
回答 1
Stack Overflow用户
回答已采纳
发布于 2016-08-24 16:32:29
根据最新chartjs版本的文档,需要在要堆栈它们的轴中将堆栈属性设置为true。所以在你的情况下应该是:
       options: {
          scales: {
            yAxes: [{
              scaleLabel: {
                display: true,
                labelString: 'Income in $'
              },
              stacked: true
            }]
          }
}有关更多信息,请访问ChartJs文档
页面原文内容由Stack Overflow提供。腾讯云小微IT领域专用引擎提供翻译支持
原文链接:
https://stackoverflow.com/questions/39127743
复制相关文章
相似问题
腾讯云开发者

Copyright © 2013 - 2026 Tencent Cloud. All Rights Reserved. 腾讯云 版权所有
深圳市腾讯计算机系统有限公司 ICP备案/许可证号:粤B2-20090059 ![]() 粤公网安备44030502008569号
粤公网安备44030502008569号
腾讯云计算(北京)有限责任公司 京ICP证150476号 | 京ICP备11018762号