
如何避免创建多个svg元素?
如何避免创建多个svg元素?
提问于 2016-08-18 17:15:46
我正在尝试在D3组件中构建一个angular2图表。当我单击链接创建D3图表时,它会创建它的一个新实例。请注意创建多个SVG标记副本的HTML。有什么想法吗?为什么会发生这种情况?如何避免?
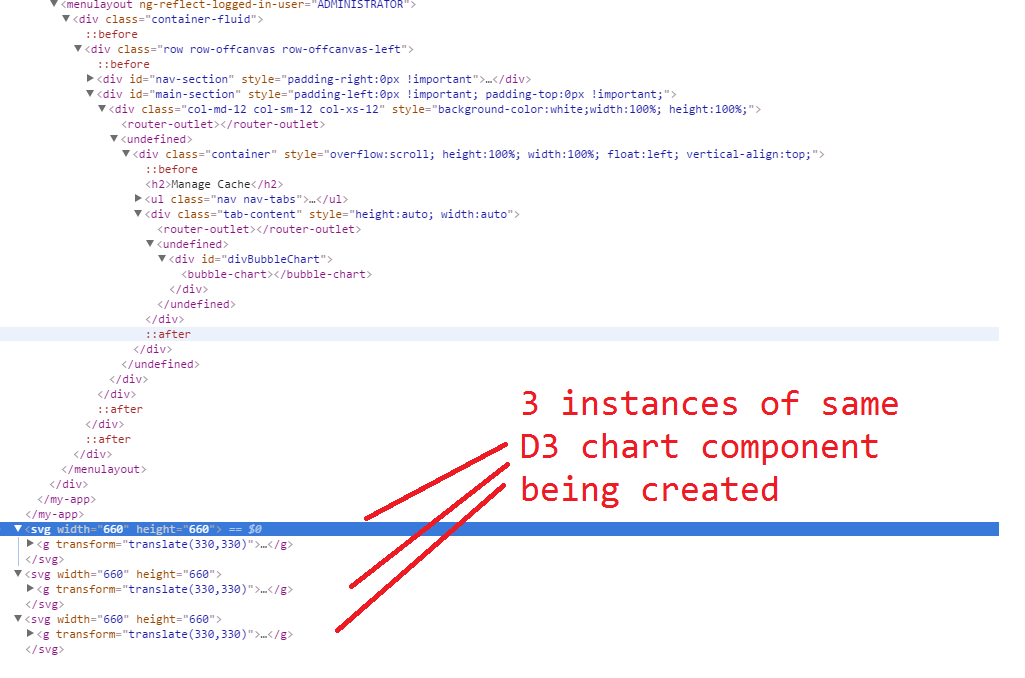
每次单击该链接创建D3图表时,它都应该清除/空现有实例并创建一个新的图表组件。
从父组件创建新实例的代码,
import { Component } from '@angular/core';
import { BubbleChart } from '../Charts/BubbleChart';

@Component({
    template: `
<div id="divBubbleChart">
    <bubble-chart></bubble-chart>
</div>
`,
    directives: [BubbleChart]
})

export class CacheVisualization {
    constructor() {
        console.log("CacheVisualization component being called");
    }
}
子d3组件
import { Component, ViewEncapsulation } from '@angular/core';
import { HTTP_PROVIDERS, Http } from '@angular/http';
import { Configuration } from '../Configuration/Configuration';
declare var d3: any;
@Component({
selector: 'bubble-chart',
styleUrls: ['css/BubbleChart.css'],
providers: [Configuration, HTTP_PROVIDERS],
template: ``,
encapsulation: ViewEncapsulation.None
})
export class BubbleChart {
public resultData: any;
public chartData: any;
margin = 5;
diameter = 660;
constructor(private _Configuration: Configuration) {
console.log("In constructor of BubbleChartComponent");
this.DrawBubbleChart();
}
private DrawBubbleChart(): void {
console.log("Inside DrawBubbleChart in BubbleChartComponent");
//console.log(this.resultData);
var color = d3.scale.linear()
.domain([-1, 5])
.range(["hsl(152,80%,80%)", "hsl(228,30%,40%)"])
.interpolate(d3.interpolateHcl);
var pack = d3.layout.pack()
.padding(2)
.size([this.diameter - this.margin, this.diameter - this.margin])
.value(function (d) { return d.size; })
var svg = d3.select("body").append("svg")
.attr("width", this.diameter)
.attr("height", this.diameter)
.append("g")
.attr("transform", "translate(" + this.diameter / 2 + "," + this.diameter / 2 + ")");
var chart = d3.json(this._Configuration.BLUESKYDATACACHEAPI_GETEXTRACTORQUEUESLATEST, (error, root) => {
if (error) throw error;
var focus = root,
nodes = pack.nodes(root),
view;
var circle = svg.selectAll("circle")
.data(nodes)
.enter().append("circle")
.attr("class", function (d) { return d.parent ? d.children ? "node" : "node node--leaf" : "node node--root"; })
.style("fill", (d) => { return d.children ? color(d.depth) : null; })
.on("click", (d) => { if (focus !== d) zoom.call(this, d), d3.event.stopPropagation(); });
var text = svg.selectAll("text")
.data(nodes)
.enter().append("text")
.attr("class", "label")
.style("fill-opacity", function (d) { return d.parent === root ? 1 : 0; })
.style("display", function (d) { return d.parent === root ? "inline" : "none"; })
.text(function (d) { return d.name; });
var node = svg.selectAll("circle,text");
d3.select("body")
.style("background", "white")
//.style("vertical-align", "top")
//.style("background", color(-1))
.on("click", () => { zoom.call(this, root); });
zoomTo.call(this, [root.x, root.y, root.r * 2 + this.margin]);
function zoom(d) {
var focus0 = focus; focus = d;
var transition = d3.transition()
.duration(d3.event.altKey ? 7500 : 750)
.tween("zoom", (d) => {
var i = d3.interpolateZoom(view, [focus.x, focus.y, focus.r * 2 + this.margin]);
return (t) => { zoomTo.call(this, i(t)); };
});
transition.selectAll("text")
.filter(function (d) { return d.parent === focus || this.style.display === "inline"; })
.style("fill-opacity", function (d) { return d.parent === focus ? 1 : 0; })
.each("start", function (d) { if (d.parent === focus) this.style.display = "inline"; })
.each("end", function (d) { if (d.parent !== focus) this.style.display = "none"; });
}
function zoomTo(v) {
var k = this.diameter / v[2]; view = v;
node.attr("transform", function (d) { return "translate(" + (d.x - v[0]) * k + "," + (d.y - v[1]) * k + ")"; });
circle.attr("r", function (d) { return d.r * k; });
}//end zoomTo
});//end chart
}//end DrawBubbleChart
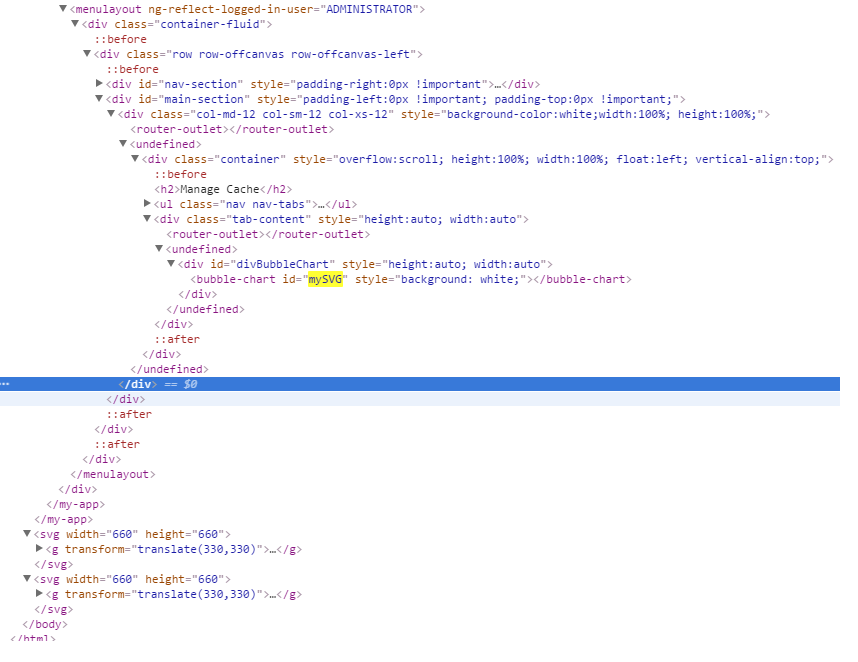
}将ID分配给创建的组件之后,它将为父html标记创建ID,而不是为"svg“标记创建ID。参考下面的快照
回答 2
Stack Overflow用户
回答已采纳
发布于 2016-08-18 17:31:22
若要删除正在创建的元素,应在删除组件时删除它们。角2有OnDestory 滑轮钩。试着实现它。在它里面,您从体内移除svg元素。
ngOnDestroy() {
  // save the element on creation and..
  // remove element from body here
}Stack Overflow用户
发布于 2016-08-18 19:15:01
解决方案1:在创建svg元素d3.select("body").append(" SVG ")之前,检查svg元素是否已经存在。如果存在,则使用它而不是追加新的SVG
var svg = d3.select('#mySVG').transition()解决方案2:为图表更新“UpdateDrawBubbleChart()”创建一个应该调用的新函数。在BubbleChart构造函数中,检查类的实例是否已经存在并调用‘UpdateDrawBubble图表’,在此函数中,可以删除SVG元素或使用d3转换。
页面原文内容由Stack Overflow提供。腾讯云小微IT领域专用引擎提供翻译支持
原文链接:
https://stackoverflow.com/questions/39024000
复制相关文章
相似问题
腾讯云开发者

Copyright © 2013 - 2026 Tencent Cloud. All Rights Reserved. 腾讯云 版权所有
深圳市腾讯计算机系统有限公司 ICP备案/许可证号:粤B2-20090059 ![]() 粤公网安备44030502008569号
粤公网安备44030502008569号
腾讯云计算(北京)有限责任公司 京ICP证150476号 | 京ICP备11018762号