
R iGraph顶点间空间的增加
R iGraph顶点间空间的增加
提问于 2016-08-17 14:38:03
我正在做一个可视化的政治书籍的亚马逊购买一起使用R和igraph。我已经能够以一种形式获得网络图,它揭示了某些书籍的地位,表明它们不仅仅是由人们购买的,而且是以同样的政治观点购买其他书籍。这是一个图表:
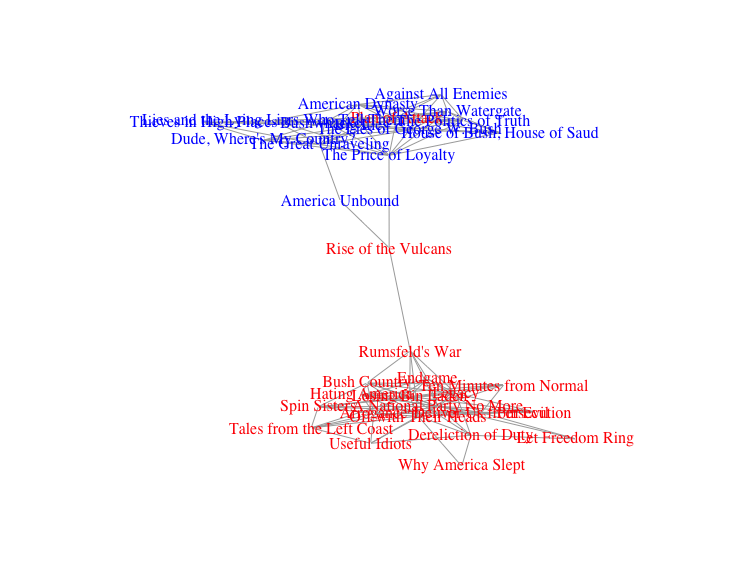
我的问题是,所有这些书都在更紧密的集群中,很难读到标签。如果可以的话,我想扩展这些星系团,而不模糊连接集群的几个标题的中间位置。
有人知道我该怎么做吗?
为了生成此图,我在这些数据中读取为一个gml文件,然后执行以下操作:
g<-read.graph("data/polbooks/polbooks.gml", format=c("gml"))
V(g)$degree <- degree(g, mode="all")
cut.off <- mean(V(g)$degree)
sub <- induced_subgraph(g, which(V(g)$degree>cut.off))
plot(sub, vertex.shape="none", vertex.size=1,
     vertex.label.color=ifelse(V(sub)$value=="l", "blue", "red"),
     layout=layout_with_fr)
我已经尝试过几个内置的布局,但它们都没有真正产生预期的结果。
回答 1
Stack Overflow用户
回答已采纳
发布于 2016-08-18 16:14:45
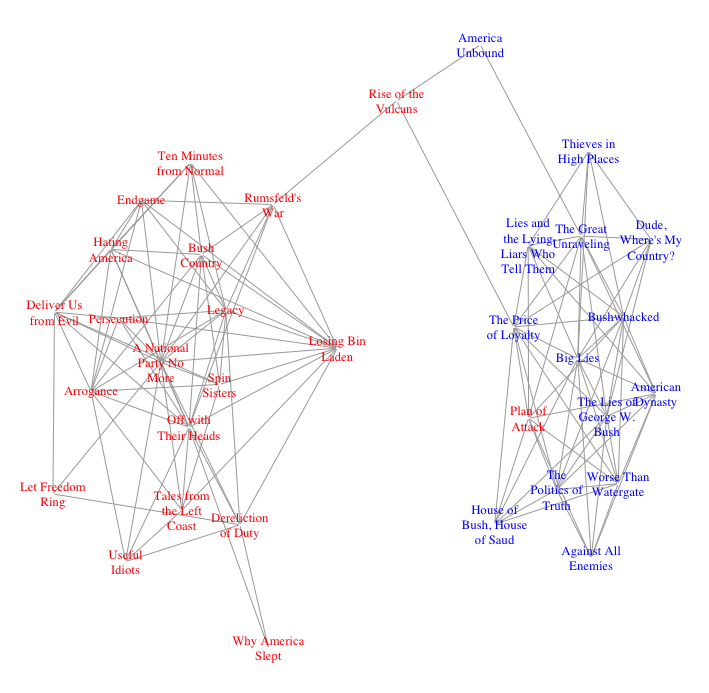
下面是我为提高图形的可读性所做的工作:
- 包裹着长长的书名。
- 缩小字体大小。
- 设置一个种子,这样布局是可重复的,允许你保留你喜欢的“随机”布局。
- 使用图形布局代码从另一个,所以回答,以增加节点分离。
以下是实现:
## Function to wrap long strings
# Source: http://stackoverflow.com/a/7367534/496488
wrap_strings <- function(vector_of_strings,width){
  as.character(sapply(vector_of_strings, FUN=function(x){
                        paste(strwrap(x, width=width), collapse="\n")
                        }))
  }

# Apply the function to wrap the node labels
V(sub)$label = wrap_strings(V(sub)$label, 12)

## Shrink font
V(sub)$label.cex = 0.8

# Function to increase node separation (for explanatory details, see the link below)
# Source: http://stackoverflow.com/a/28722680/496488
layout.by.attr <- function(graph, wc, cluster.strength=1,layout=layout.auto) {
  g <- graph.edgelist(get.edgelist(graph)) # create a lightweight copy of graph w/o the attributes.
  E(g)$weight <- 1

  attr <- cbind(id=1:vcount(g), val=wc)
  g <- g + vertices(unique(attr[,2])) + igraph::edges(unlist(t(attr)), weight=cluster.strength)

  l <- layout(g, weights=E(g)$weight)[1:vcount(graph),]
  return(l)
}

## Make layout reproducible. Different values will produce different layouts,
##  but setting a seed will allow you to reproduce a layout if you like it.
set.seed(3)
现在让我们绘制这个图表:
plot(sub, vertex.shape="none", vertex.size=1,
     vertex.label.color=ifelse(V(sub)$value=="l", "blue", "red"),
     layout=layout.by.attr(sub, wc=1))
页面原文内容由Stack Overflow提供。腾讯云小微IT领域专用引擎提供翻译支持
原文链接:
https://stackoverflow.com/questions/38999656
复制相关文章
相似问题
腾讯云开发者

Copyright © 2013 - 2026 Tencent Cloud. All Rights Reserved. 腾讯云 版权所有
深圳市腾讯计算机系统有限公司 ICP备案/许可证号:粤B2-20090059  粤公网安备44030502008569号
腾讯云计算(北京)有限责任公司 京ICP证150476号 | 京ICP备11018762号