
在将D3图表定位到以angular2包装的指定位置时发出
在将D3图表定位到以angular2包装的指定位置时发出
提问于 2016-08-17 01:14:48
我面临一些问题,在定位图表和改变颜色的圆圈内的气泡图。我需要通过使用一些json内容来绘制一个包装在angular2组件中的气泡图。在指定的空间/区域内,我在图表的定位方面面临一些问题。
请参考应用程序布局的快照。在基于某些用户单击事件的应用程序中,应该在下面加载气泡图,但目前它正在页面下方加载,即在整个页面布局下加载。此气泡图配置了angular2中的路由,预期将加载到指定的路由器出口标记中,但它将加载到
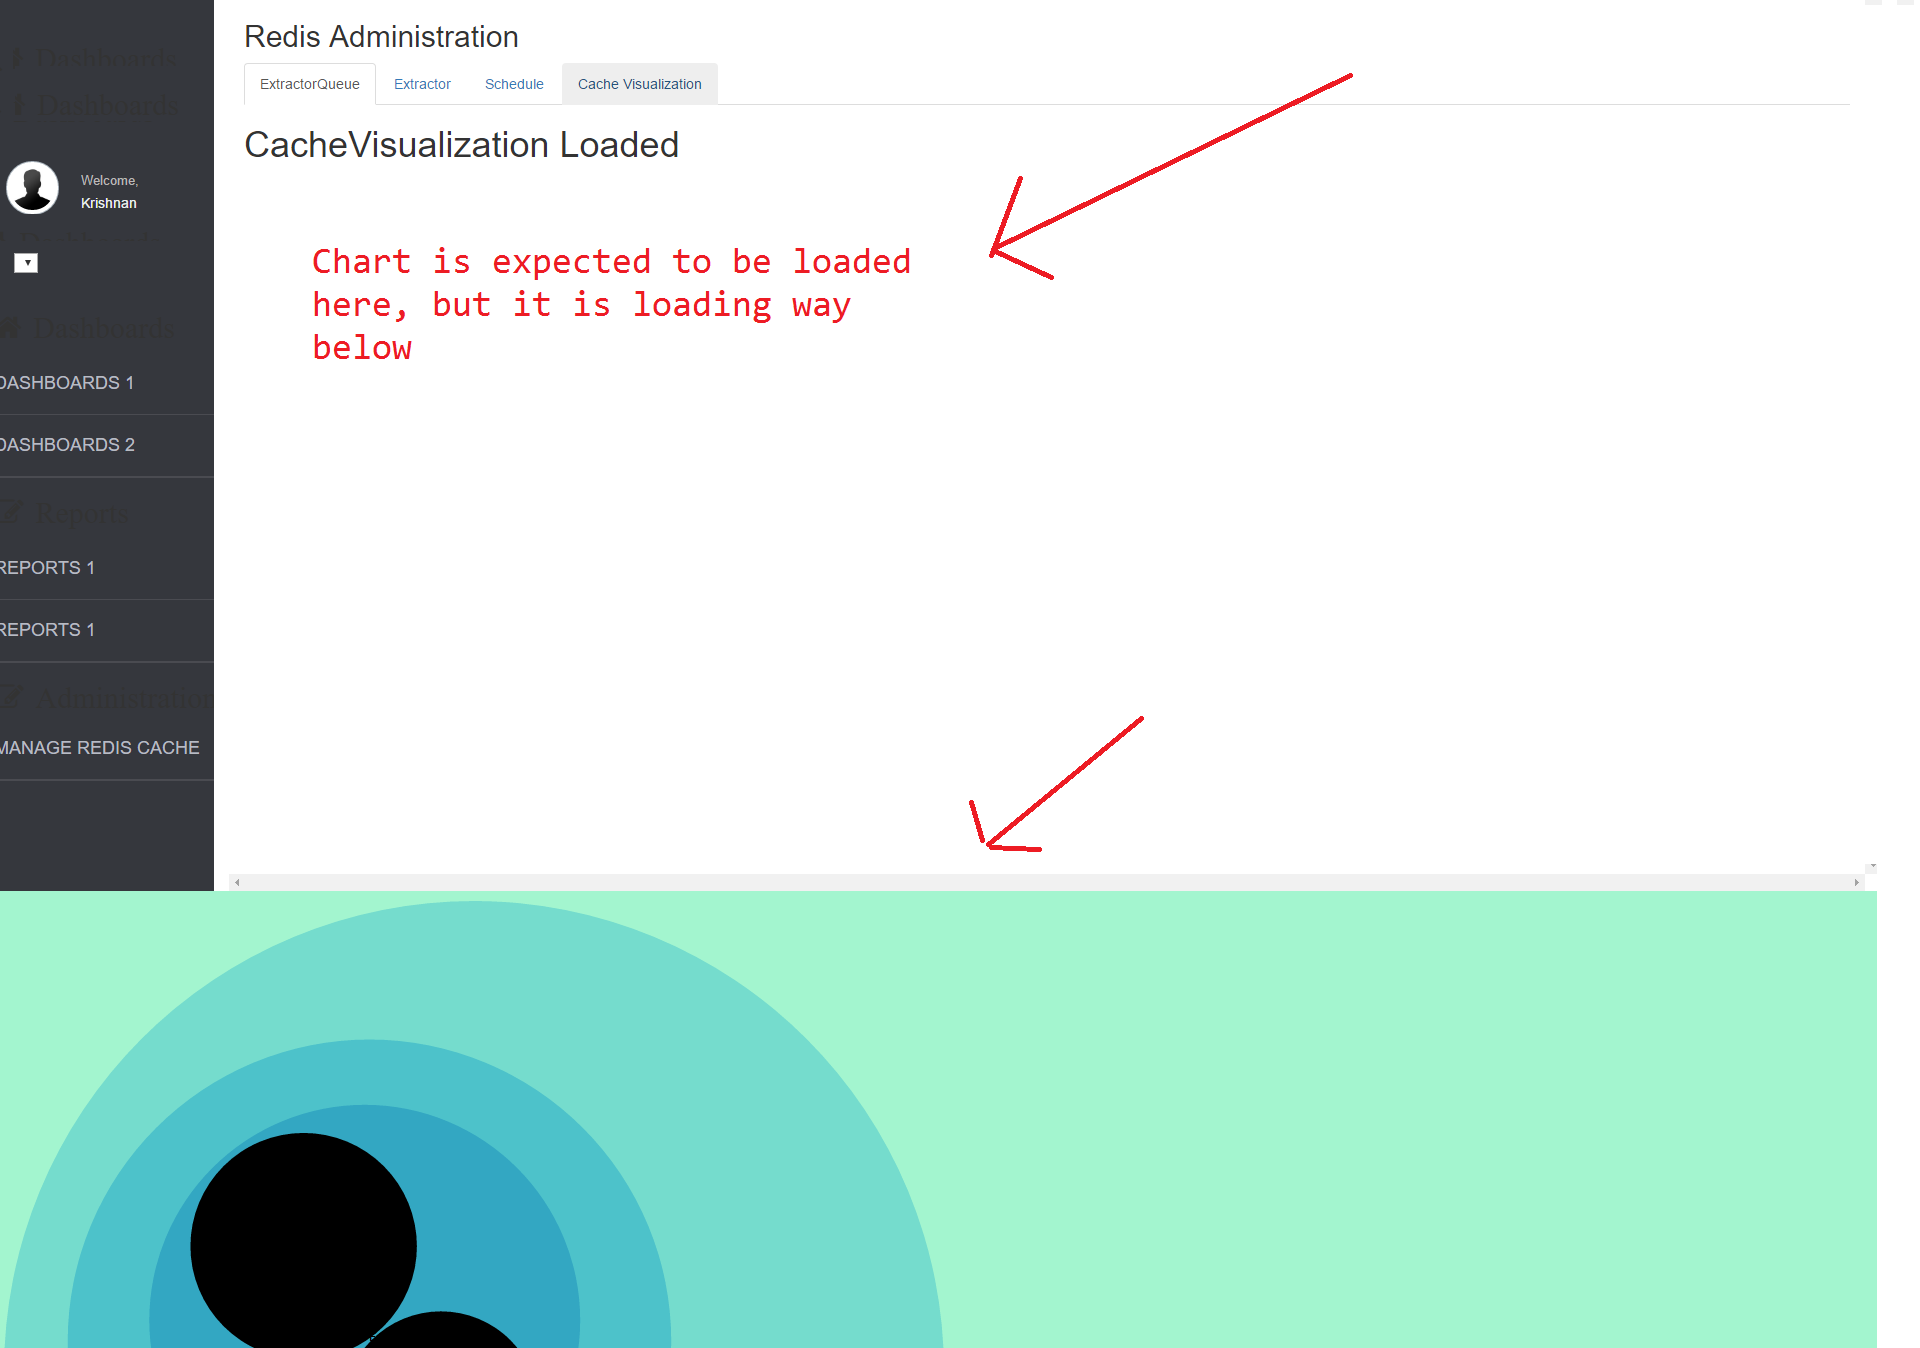
注:1.D3.js用于绘制包装在angular2组件中的气泡图。2.我试图缩小图表组件的宽度和高度,但仍然没有在所需的位置呈现。
用于应该呈现的图表的HTML
<div class="container" style="overflow:scroll; height:100%; width:100%;">
    <h2>Redis Administration</h2>
    <ul class="nav nav-tabs">
        <li class="active"><a data-toggle="tab" href="#ExtractorQueue" [routerLink]="['./']">ExtractorQueue</a></li>
        <li><a data-toggle="tab" href="#Extractor" [routerLink]="['Extractor']">Extractor</a></li>
        <li><a data-toggle="tab" href="#Schedule" [routerLink]="['Schedule']">Schedule</a></li>
        <li><a data-toggle="tab" href="#CacheVisualization" [routerLink]="['CacheVisualization']">Cache Visualization</a></li>
    </ul>
    <div class="tab-content">
        <router-outlet></router-outlet>
    </div>
</div>
D3封装在angular2组件代码中
import { Component, ViewEncapsulation } from '@angular/core';
import { HTTP_PROVIDERS, Http } from '@angular/http';
import { Configuration } from '../Configuration/Configuration';

declare var d3: any;

@Component({
    selector: 'bubble-chart',
    styleUrls: ['css/BubbleChart.css'],
    providers: [Configuration, HTTP_PROVIDERS],
    template: ``,
    encapsulation: ViewEncapsulation.None
})
export class BubbleChart {
    public resultData: any;
    public chartData: any;
    margin = 5;
    diameter = 660;

    constructor(private _Configuration: Configuration) {
        console.log("In constructor of BubbleChartComponent");
        this.DrawBubbleChart();
    }

    private DrawBubbleChart(): void {
        console.log("Inside DrawBubbleChart in BubbleChartComponent");
        //console.log(this.resultData);

        var color = d3.scale.linear()
            .domain([-1, 5])
            .range(["hsl(152,80%,80%)", "hsl(228,30%,40%)"])
            .interpolate(d3.interpolateHcl);

        var pack = d3.layout.pack()
            .padding(2)
            .size([this.diameter - this.margin, this.diameter - this.margin])
            .value(function (d) { return d.size; })

        var svg = d3.select("body").append("svg")
            .attr("width", this.diameter)
            .attr("height", this.diameter)
            .append("g")
            .attr("transform", "translate(" + this.diameter / 2 + "," + this.diameter / 2 + ")");

        var chart = d3.json(this._Configuration.BLUESKYDATACACHEAPI_GETEXTRACTORQUEUESLATEST, (error, root) => {
            if (error) throw error;

            var focus = root,
                nodes = pack.nodes(root),
                view;

            var circle = svg.selectAll("circle")
                .data(nodes)
                .enter().append("circle")
                .attr("class", function (d) { return d.parent ? d.children ? "node" : "node node--leaf" : "node node--root"; })
                .style("fill", (d) => { return d.children ? color(d.depth) : null; })
                .on("click", (d) => { if (focus !== d) zoom.call(this, d), d3.event.stopPropagation(); });

            var text = svg.selectAll("text")
                .data(nodes)
                .enter().append("text")
                .attr("class", "label")
                .style("fill-opacity", function (d) { return d.parent === root ? 1 : 0; })
                .style("display", function (d) { return d.parent === root ? "inline" : "none"; })
                .text(function (d) { return d.name; });

            var node = svg.selectAll("circle,text");

            d3.select("body")
                .style("background", "white")
                //.style("background", color(-1))
                .on("click", () => { zoom.call(this, root); });

            zoomTo.call(this, [root.x, root.y, root.r * 2 + this.margin]);

            function zoom(d) {
                var focus0 = focus; focus = d;

                var transition = d3.transition()
                    .duration(d3.event.altKey ? 7500 : 750)
                    .tween("zoom", (d) => {
                        var i = d3.interpolateZoom(view, [focus.x, focus.y, focus.r * 2 + this.margin]);
                        return (t) => { zoomTo.call(this, i(t)); };
                    });

                transition.selectAll("text")
                    .filter(function (d) { return d.parent === focus || this.style.display === "inline"; })
                    .style("fill-opacity", function (d) { return d.parent === focus ? 1 : 0; })
                    .each("start", function (d) { if (d.parent === focus) this.style.display = "inline"; })
                    .each("end", function (d) { if (d.parent !== focus) this.style.display = "none"; });
            }

            function zoomTo(v) {
                var k = this.diameter / v[2]; view = v;
                node.attr("transform", function (d) { return "translate(" + (d.x - v[0]) * k + "," + (d.y - v[1]) * k + ")"; });
                circle.attr("r", function (d) { return d.r * k; });
            }//end zoomTo

        });//end chart

    }//end DrawBubbleChart

}
回答 1
Stack Overflow用户
回答已采纳
发布于 2016-08-24 14:29:09
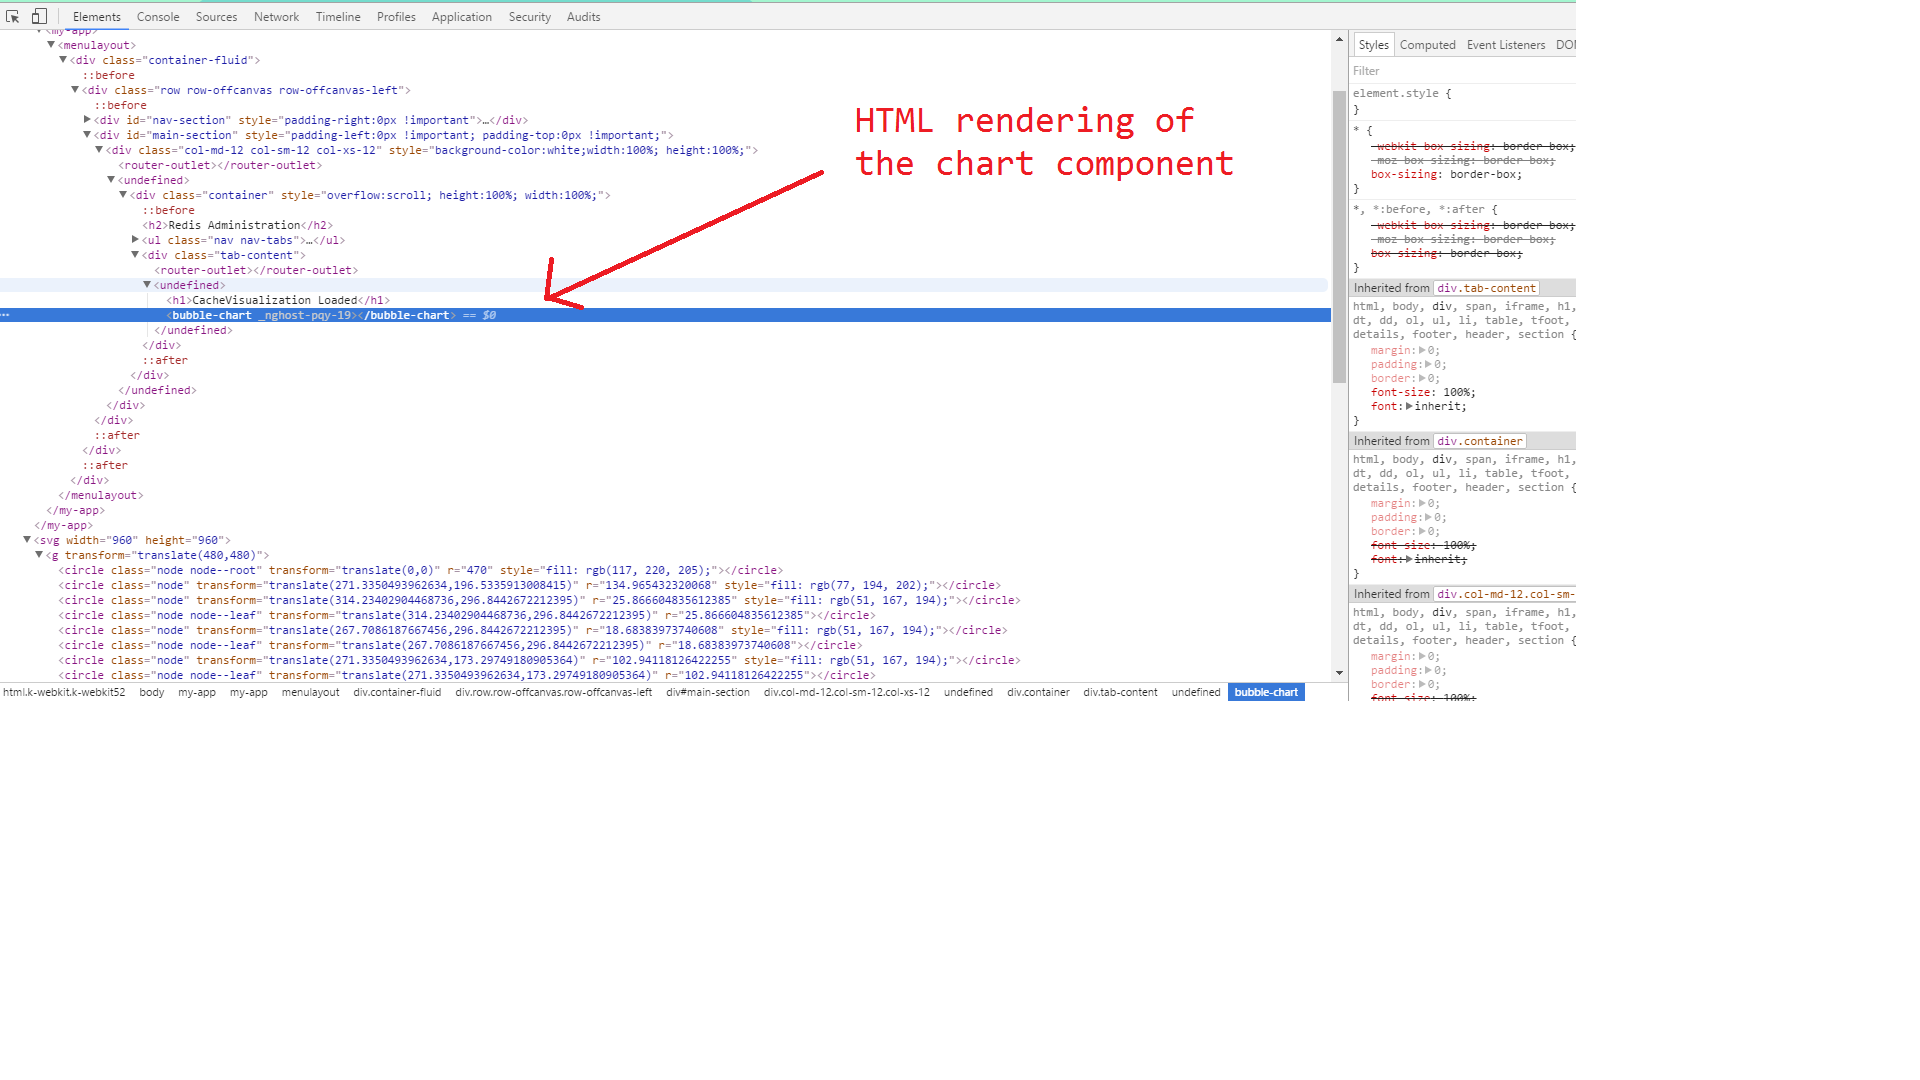
我找到了解决这个问题的办法。由于D3一起生成svg标记远离指定位置,所以最好使用nativeElement强制D3在指定位置生成图表。通过这种方式,我们强制D3在特定位置的指定DOM元素中生成
  var svg = d3.select(this.el.nativeElement).append("svg")
            .attr("width", (this.diameter + 800))
            .attr("height", this.diameter)
            .attr('id', 'mySVG')
            .append("g")
.attr("transform", "translate(" + this.diameter / 2 + "," + this.diameter / 2 + ")");页面原文内容由Stack Overflow提供。腾讯云小微IT领域专用引擎提供翻译支持
原文链接:
https://stackoverflow.com/questions/38986724
复制相关文章
相似问题
腾讯云开发者

Copyright © 2013 - 2026 Tencent Cloud. All Rights Reserved. 腾讯云 版权所有
深圳市腾讯计算机系统有限公司 ICP备案/许可证号:粤B2-20090059 ![]() 粤公网安备44030502008569号
粤公网安备44030502008569号
腾讯云计算(北京)有限责任公司 京ICP证150476号 | 京ICP备11018762号