
如何在clmm后使用dotplot
我试图在clmm之后绘制随机效果,但我得到了错误消息:“sort.list(Y)中的错误:‘X’必须是`sort.list的原子效应‘,您是否称’排序‘为一个列表?”以下代码代表了我的实际代码。
library(ordinal)
library(lattice)

###I am using the wine data in the ordinal package
d<-data.frame(wine)
result<-clmm(rating~1+temp+contact+(1+temp|judge), data=d)
###In my actual codes, I put "as.ordered(rating)" instead of "rating".
然后,我试图绘制温度的随机效应,并判断:
dotplot(ranef(result, condVar=TRUE))然后,错误信息出现:“sort.list(Y)中的错误:‘X’必须是`sort.list的原子”,您在列表中调用'sort‘了吗?
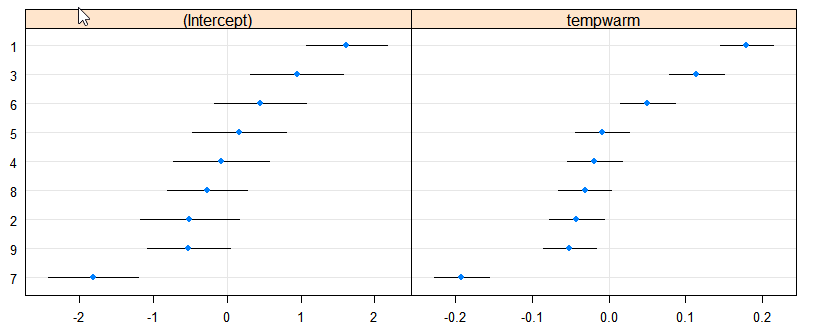
我最好的猜测是,评级是按照clmm下的顺序实现的,考虑到错误信息,这对我来说似乎是有意义的。然而,猜测是高度投机的,我不知道如何处理这种情况。具体来说,我想要绘制的是临时的随机效应和判断(拦截)与他们的顺式。请参考下面我用下面的代码生成的图
result2<-lmer(as.numeric(rating)~1+temp+contact+(1+temp|judge), data=d)
dotplot(ranef(result2, condVar=TRUE))
如果您能就如何避免使用clmm阻止我使用上面的代码的冲突情况给出任何评论或建议,我们将非常感激。
回答 2
Stack Overflow用户
发布于 2016-08-16 15:25:33
我一开始试图破解lme4:::dotplot.ranef.mer的内核,但事实证明,用reshape2::melt和ggplot2更容易做到这一点。抱歉,如果你真的很喜欢lattice .
请注意,在技术上,这些不是“置信区间”(因为预测的条件模式在技术上并不是“估计”).
将条件模式的点估计和SE重新排列成有用的形状:
library(reshape2)
melt.ranef.clmm <- function(re,cv) {
  reList <- lapply(re,
        function(x) {
           x$id <- reorder(factor(rownames(x)),x[,1])
           return(melt(x,id.var="id"))
        })
  cvList <- lapply(cv,melt,id.var=NULL,value.name="se")
  mm <- Map(cbind,reList,cvList)
  return(mm)
}将其应用于模型(m1是一个拟合的模型):
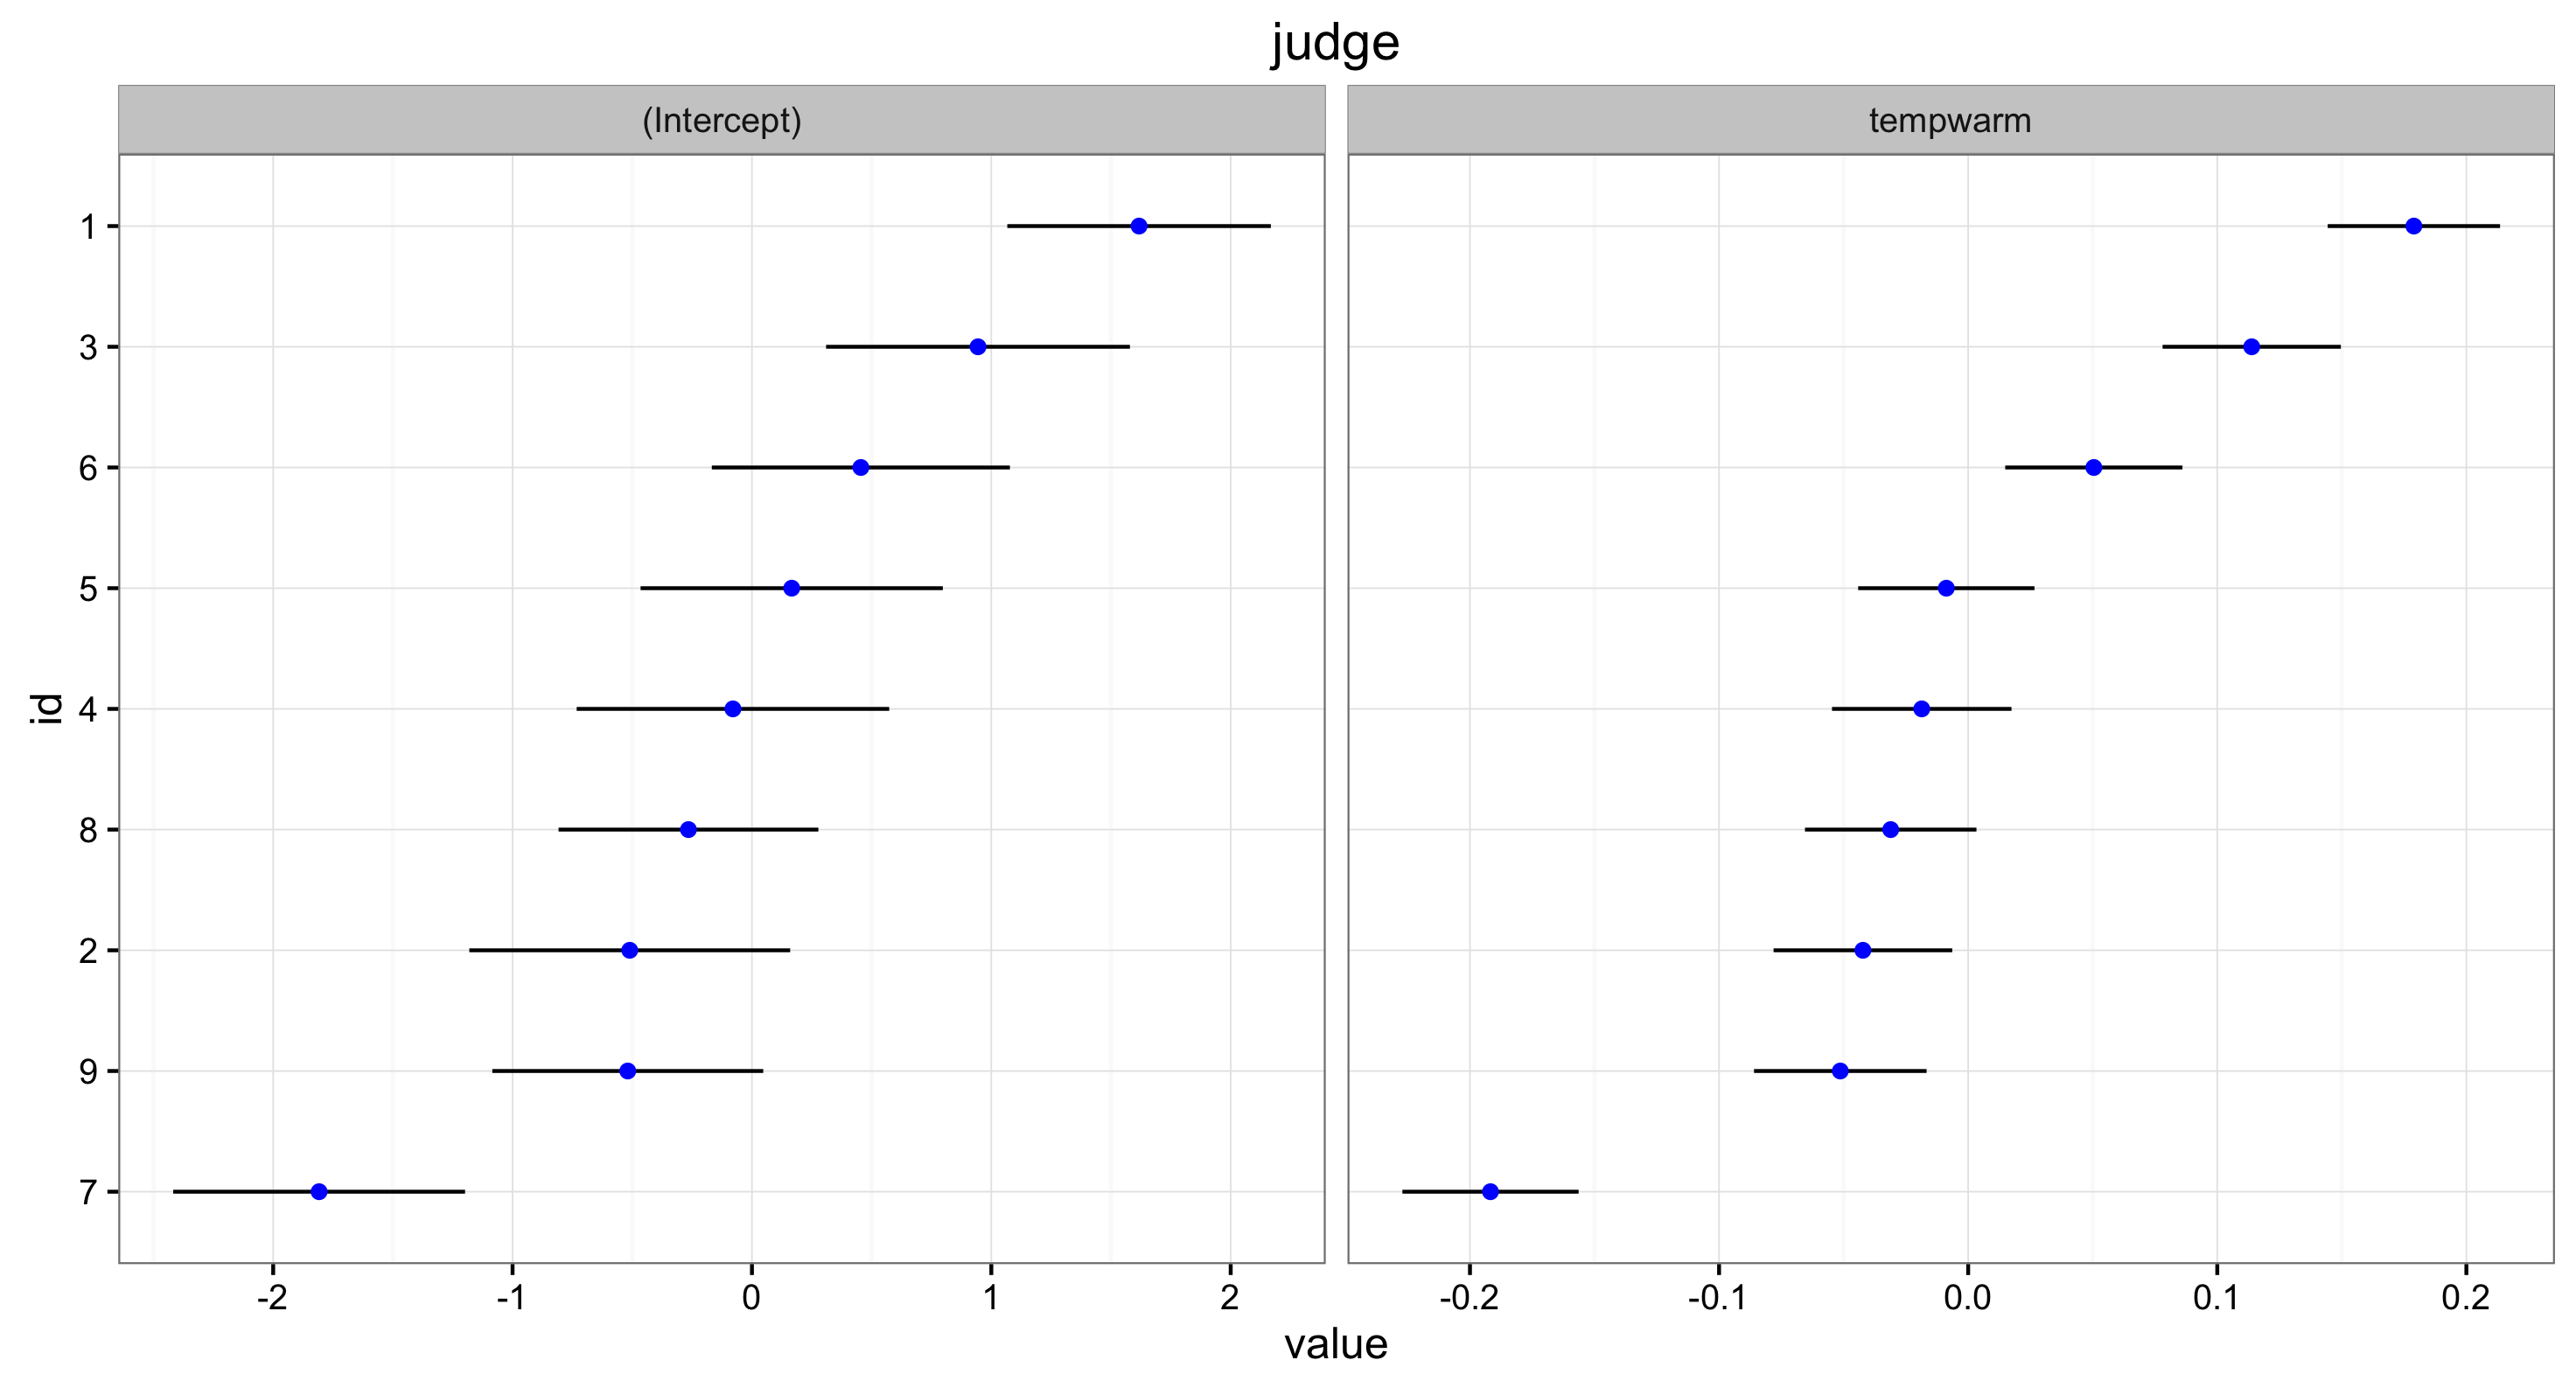
ss <- melt.ranef.clmm(ranef(m1),condVar(m1))情节:
library(ggplot2); theme_set(theme_bw())
ggplot(ss[[1]],aes(value,id))+
  geom_errorbarh(aes(xmin=value-1.96*se,xmax=value+1.96*se),
                 height=0)+
  ggtitle(names(ss)[1])+
  geom_point(colour="blue")+
  facet_wrap(~variable,scale="free_x")
Stack Overflow用户
发布于 2016-08-16 15:25:11
dotplot不知道如何处理来自ranef(clmm(...))的结果,因为该结果没有关联的方法。
“简单”的回答是,您可以设置结果的类(与ranef(lm34::lmer(...))提供的类相同),以避免这种情况:
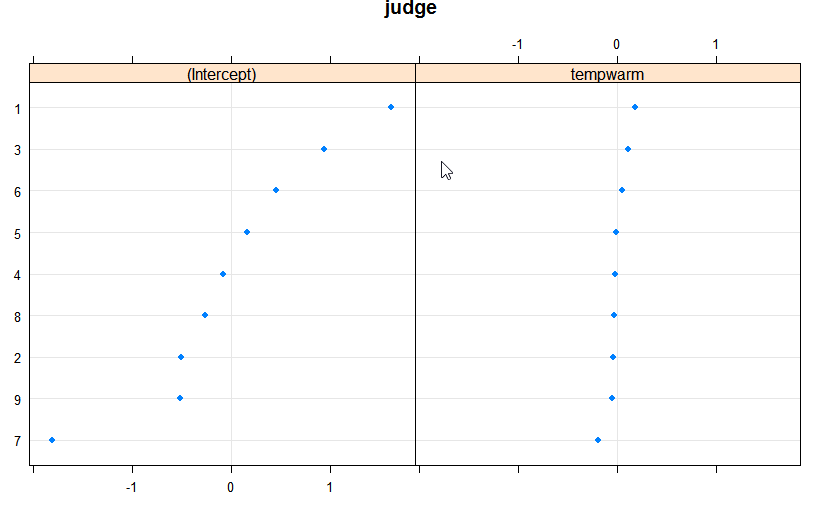
r1 <- ranef(result, condVar=TRUE)
class(r1)="ranef.mer"
dotplot(r1)
这将得到一个点图,但没有条件标准错误条。
也要绘制条件错误条,需要付出更多的努力。问题是,lme4::dotplot.ranef.mer查找名为postVar的属性中的错误,而clmm则以名为condVar的不同格式属性提供错误。幸运的是,编辑dotplot.ranef.mer以处理clmm对象相对简单。我们可以通过在函数中添加一行来做到这一点:
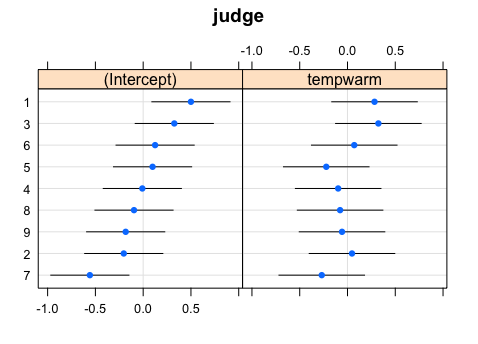
if (!is.null(cv <- attr(xt, "condVar"))) se <- as.vector(unlist(cv))然后我们就可以用
result<-clmm(rating~1+temp+contact+(1+temp|judge), data=d)
r1 <- ranef(result, condVar=TRUE)
dp(r1, scales = list(x = list(relation = 'free')))
这是绘制这幅图的全部函数。这是dotplot.ranef.mer的逐字副本,上面提到了添加一行
dp <- function (x, data, main = TRUE, ...)
{
  prepanel.ci <- function(x, y, se, subscripts, ...) {
    if (is.null(se))
      return(list())
    x <- as.numeric(x)
    hw <- 1.96 * as.numeric(se[subscripts])
    list(xlim = range(x - hw, x + hw, finite = TRUE))
  }
  panel.ci <- function(x, y, se, subscripts, pch = 16, horizontal = TRUE,
                       col = dot.symbol$col, lty = dot.line$lty, lwd = dot.line$lwd,
                       col.line = dot.line$col, levels.fos = unique(y), groups = NULL,
                       ...) {
    x <- as.numeric(x)
    y <- as.numeric(y)
    dot.line <- trellis.par.get("dot.line")
    dot.symbol <- trellis.par.get("dot.symbol")
    sup.symbol <- trellis.par.get("superpose.symbol")
    panel.abline(h = levels.fos, col = col.line, lty = lty,
                 lwd = lwd)
    panel.abline(v = 0, col = col.line, lty = lty, lwd = lwd)
    if (!is.null(se)) {
      se <- as.numeric(se[subscripts])
      panel.segments(x - 1.96 * se, y, x + 1.96 * se, y,
                     col = "black")
    }
    panel.xyplot(x, y, pch = pch, ...)
  }
  f <- function(nx, ...) {
    xt <- x[[nx]]
    ss <- stack(xt)
    mtit <- if (main)
      nx
    ss$ind <- factor(as.character(ss$ind), levels = colnames(xt))
    ss$.nn <- rep.int(reorder(factor(rownames(xt)), xt[[1]],
                              FUN = mean, sort = sort), ncol(xt))
    se <- NULL
    if (!is.null(pv <- attr(xt, "postVar")))
      se <- unlist(lapply(1:(dim(pv)[1]), function(i) sqrt(pv[i, i, ])))
#############################################################
# Next line is the inseerted line to deal with clmm objects
#############################################################
    if (!is.null(cv <- attr(xt, "condVar"))) se <- as.vector(unlist(cv))
    dotplot(.nn ~ values | ind, ss, se = se, prepanel = prepanel.ci,
            panel = panel.ci, xlab = NULL, main = mtit, ...)
  }
  setNames(lapply(names(x), f, ...), names(x))
}https://stackoverflow.com/questions/38977094
复制相似问题
腾讯云开发者

Copyright © 2013 - 2026 Tencent Cloud. All Rights Reserved. 腾讯云 版权所有
深圳市腾讯计算机系统有限公司 ICP备案/许可证号:粤B2-20090059 ![]() 粤公网安备44030502008569号
粤公网安备44030502008569号
腾讯云计算(北京)有限责任公司 京ICP证150476号 | 京ICP备11018762号