
如何在Complexheatmap包中实现分色
如何在Complexheatmap包中实现分色
提问于 2016-08-11 19:46:52
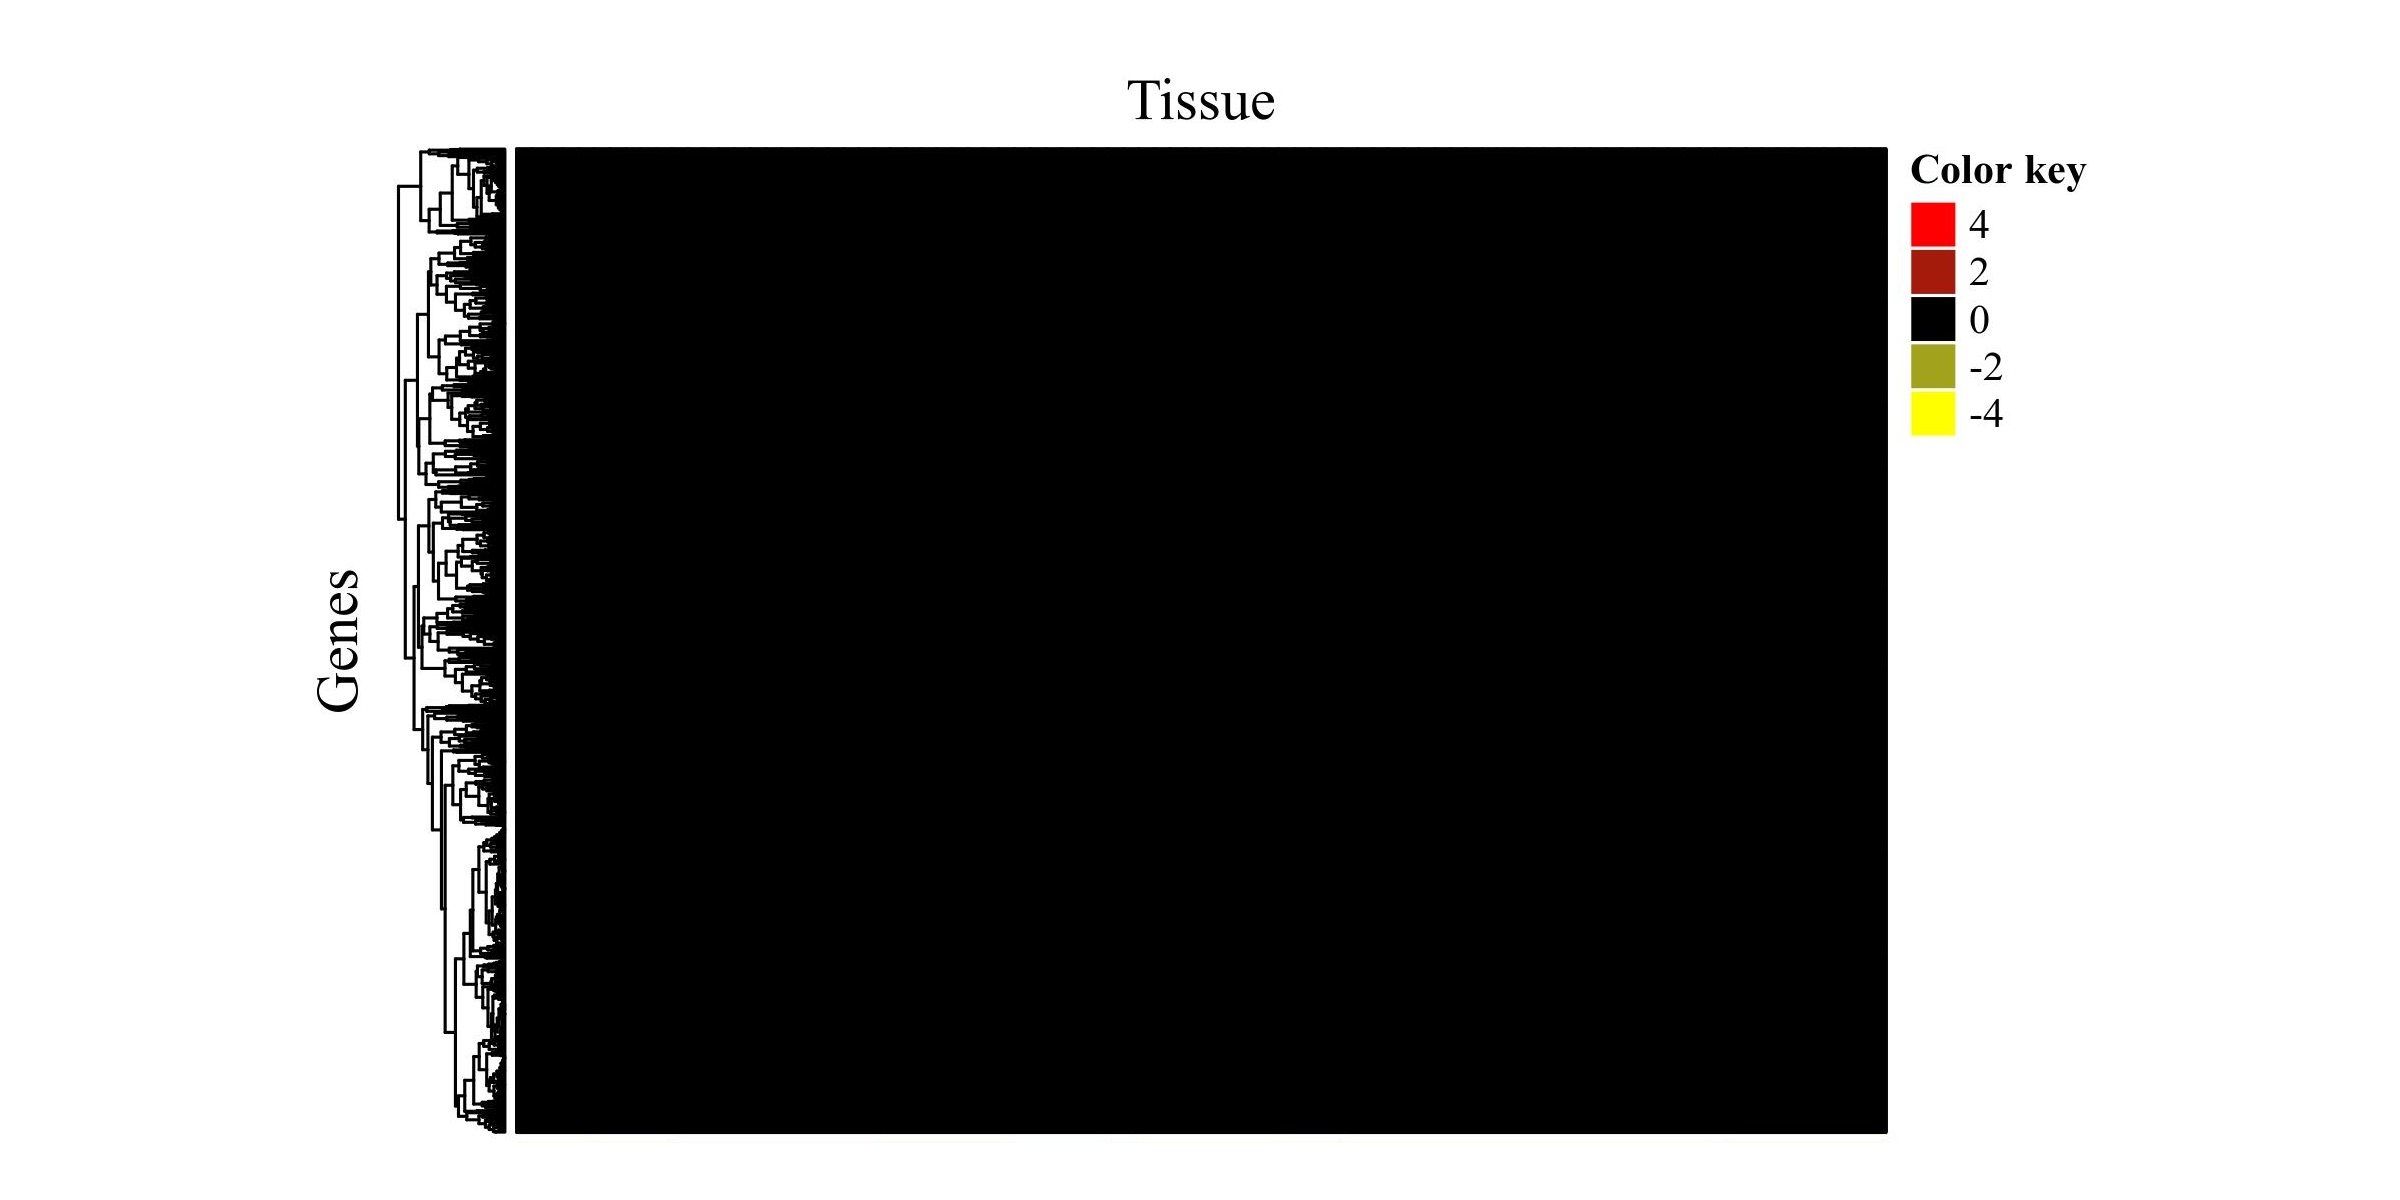
我正在尝试创建一个使用复合热图包的热图。除了我在整个情节中只能看到黑色外,一切都很正常。我认为适当的分色应该能起作用,但我不知道如何解决这个问题。
#load required libraries
 library(extrafont)
 #font_import() # only one time required when first time use the      library       extrafont
 #y
 fonts()
 loadfonts()
 library(ComplexHeatmap)
 library(circlize)

  #upload expression data
  #heatdata<- read.table("probe.expression",header=TRUE,row.names=1)
  dim(heatdata)
  head(heatdata)

#scale row
rm <- rowMeans(heatdata)
sx <- apply(heatdata, 1, sd)
zz <- sweep(heatdata,1,rm)
zz <- sweep(zz, 1, sx, "/")
zzz <- t(scale(t(heatdata)))


Heatmap(zzz,
name = "Color key", # legend title
rect_gp = gpar(col = "black"), # cell border
column_title = "Tissue",
column_title_side = "top",
row_title = "Genes",
row_title_side = "left",
clustering_distance_rows = "pearson", #"euclidean", "maximum", "man-
                                  #hattan", "canberra", "binary", "minkowski", #"pearson",                             #"spearman", "kendall"
row_dend_side = "left",  #should the row cluster be put on the left or right of the heatmap?
 #row_name_side = "right",  #should the row cluster be put on the left or right of the heatmap?
show_row_names = FALSE,
column_dend_height = unit(3,"cm"),
show_column_dend = FALSE,
show_column_names= FALSE,
#bottom_annotation = ha,
#bottom_annotation_height = unit(1, "cm"),
col = colorRamp2(c(-2, 0,10),c("green","black", "red"))

)
和
min(zzz)给-1.96339
max(zzz)给9.238137。我的最后一个情节如下
测试数据可以找到这里
回答 1
Stack Overflow用户
回答已采纳
发布于 2016-08-12 14:54:32
我认为您应该删除"rect_gp =gpar( cell =“black”),因为我猜在矩阵中有许多行,如果设置边框颜色,颜色将主要由单元格边框覆盖。
页面原文内容由Stack Overflow提供。腾讯云小微IT领域专用引擎提供翻译支持
原文链接:
https://stackoverflow.com/questions/38904914
复制相关文章
相似问题
腾讯云开发者

Copyright © 2013 - 2026 Tencent Cloud. All Rights Reserved. 腾讯云 版权所有
深圳市腾讯计算机系统有限公司 ICP备案/许可证号:粤B2-20090059 ![]() 粤公网安备44030502008569号
粤公网安备44030502008569号
腾讯云计算(北京)有限责任公司 京ICP证150476号 | 京ICP备11018762号