
如何在排序中修复此问题
如何在排序中修复此问题
提问于 2016-08-09 12:42:41
你好,堆栈溢出社区,我有一个关于编码的问题。下面是我的代码、数据格式和输出,下面是我的问题。
数据格式:
 ID  time var1 var2 var3
    a    1    2    3    4
    a    5    6    7    8
    b    9    11   12   13
    b    14   15   16   17
    c    .    .    .    .
    c    .    .    .    .
    and so forth
代码:
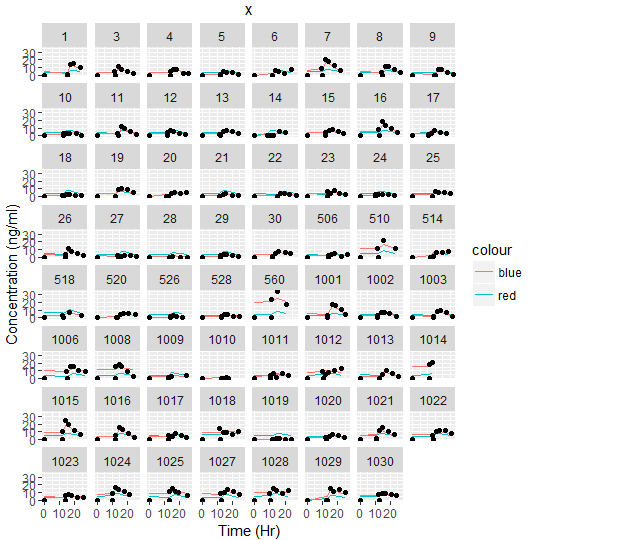
  gg1 <- ggplot() + geom_line(aes(x=TIME, y=Var1, col="red"), FILE) +
    geom_line(aes(x=TIME, y=Var2, col="blue"), FILE) +
    geom_point(aes(x=TIME, y=Var3), Model_20160806) + facet_wrap( ~ ID)+
    xlab("Time (Hr)") + ylab("Concentration (ng/ml)") + ggtitle("x")
我一直在努力以正确的格式制作情节,任何帮助都将是非常感谢的。
- 如您所见,col=“红色/蓝色”显示为图例而不是颜色?有办法解决吗?
- 如何在输出的底部添加Var1、Var2、Var3的图例?
- 我尝试将facet_wrap( ~ ID,ncol=3)添加到代码中,但它不起作用,并提供了一个null。有办法解决这个问题吗?
- 由于有大量的单元格样本,是否有一种方法可以将图形生成到多个页面上,从而使图形可见并可解释?
- 最后,为了更好地可视化转染数据,我尝试使用
gg1+theme_bw(),但这是行不通的。
回答 2
Stack Overflow用户
发布于 2016-08-09 13:10:05
如果没有一个可重复的例子,就很难帮助你回答这些问题。
aes(..., col="blue")不工作。在aes()中,所有内容都必须引用数据格式的一列。如果在dataframe中有一个分组变量,请使用它来定义颜色。如果您希望所有东西都是蓝色的,请在aes()之外定义颜色。- 有点像
scale_colour_manual(values=c("red","green","blue"))。可能是来自Add legend to ggplot2 line plot的重复问题。 - 你能解释一下你想用
facet_wrap( ~ ID, ncol=3)做什么吗? - 是的,那是可能的。最简单的方法是创建多个图,方法是将
x分成10组。 - 这也是为什么你需要一个可复制的例子的原因。简单的回答是,
theme_bw()为我工作,我不知道为什么它不适合你。
例如:
library(car)
library(ggplot2)
data("diamonds")
ggplot(diamonds, aes(x = carat, y = cut, color = color)) +
  geom_point() +
  theme_bw()
编辑:给出一个将数据分割成10组的示例:
# Example data
df = data.frame(x = factor(rep(1:30, each = 10)), y1 = rnorm(300), y2 = rnorm(300))
# Assume that df$x is the grouping variable consisting of too many groups
# Every df$x < 10 becomes 0, 10 < df$ < 20 becomes 1, etc.
df$x2 = floor(as.numeric(df$x) / 10)
# Split the dataframe based on this new grouping variable df$x2
dfSplit = split(df, df$x2)
# do a loop over dfSplit
for (i in 1:length(dfSplit)) {
  dfForPlotting = dfSplit[[i]]
  # do plotting stuff
  ggplot(data = dfForPlotting, aes(x = y1, y = y2, color = x)) + geom_line()
}Stack Overflow用户
发布于 2016-08-09 13:09:42
关于问题2,最简单的方法是使用网格包和grid.text()。
library(grid)
par(mar=c(6.5, 2, 2, 2))
plot(1:10,1:10)
grid.text(x=0.2, y = 0.05, "Var1 = Birds, Var2 = Bees")页面原文内容由Stack Overflow提供。腾讯云小微IT领域专用引擎提供翻译支持
原文链接:
https://stackoverflow.com/questions/38851086
复制相关文章
相似问题
腾讯云开发者

Copyright © 2013 - 2026 Tencent Cloud. All Rights Reserved. 腾讯云 版权所有
深圳市腾讯计算机系统有限公司 ICP备案/许可证号:粤B2-20090059 ![]() 粤公网安备44030502008569号
粤公网安备44030502008569号
腾讯云计算(北京)有限责任公司 京ICP证150476号 | 京ICP备11018762号