
在直方图图(集群)中,如何根据情况将垂直文本替换成某些条形?
在直方图图(集群)中,如何根据情况将垂直文本替换成某些条形?
提问于 2016-08-09 08:03:04
在gnu图中,我使用的是直方图图(集群),但并不是所有的数据点都有有效值。在这些地方,我想用“不能服务”的垂直文字代替酒吧。我该怎么做呢?
我现在的代码是:
set style data histogram
set style histogram cluster gap 2
set boxwidth 0.9
set xtic rotate by -45 scale 0

set output "test.pdf"
plot 'data.txt' using 2:xtic(1) fs pattern 1 ti col, '' u 3 fs pattern 2 ti col
数据文件包含:
“磁性”“电”型 “高负荷”12000 12721.033920 “医疗负荷”15620.011886 15783.706215 “低负荷”15636.000000 16254.000000
回答 1
Stack Overflow用户
发布于 2016-08-10 10:23:24
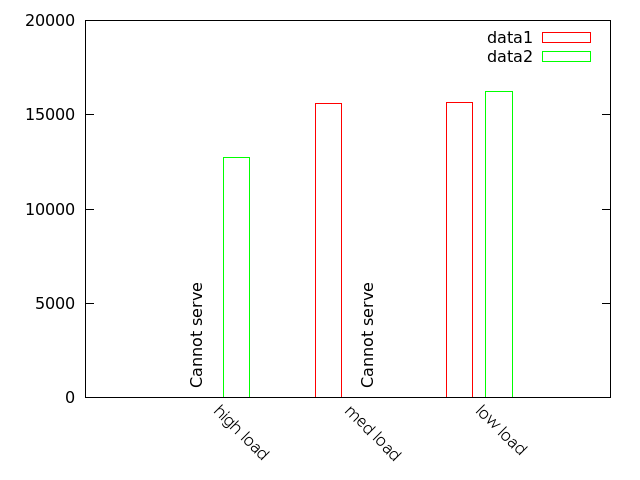
这是一种非常讨厌的方法。我修改了您的文件以添加"NaN":
"high load" NaN 12721.033920
"med load" 15620.011886 NaN
"low load" 15636.000000 16254.000000现在,我绘制了所有with boxes,其中每个框的位置是根据记录在数据文件中出现的顺序来计算的(第0列)。这里是“手动”定义的,但是您应该能够编写一个函数,根据记录的数量和从stats获得的每条记录的列数来获取stats和框分隔。而且,boxwidth将依赖于这些值。
set xtic rotate by -45 scale 0
ymax = 20000
set yrange [0:ymax]

nrecords = 3
ncolumns = 2

set xrange [0:nrecords+1]

# Calculate boxwidth from available space per column
gap = 1./ncolumns/5.
width = 1./ncolumns/2.-gap/2.
set boxwidth width

plot "data.txt" u ($0+1.-width/2.-gap/2.):($2) w boxes t "data1", \
     "" u ($0+1.+width/2.+gap/2.):($3) w boxes t "data2", \
     "" u ($0+1.):(ymax/6.):(stringcolumn(2) eq "NaN" ? \
     "Cannot serve" : ""):xtic(1) w labels rotate by 90 offset \
     first -width/2.-gap/2.,0 not, \
     "" u ($0+1.):(ymax/6.):(stringcolumn(3) eq "NaN" ? "Cannot serve" \
     : ""):xtic(1) w labels rotate by 90 offset first width/2.+gap/2.,0 not
页面原文内容由Stack Overflow提供。腾讯云小微IT领域专用引擎提供翻译支持
原文链接:
https://stackoverflow.com/questions/38845229
复制相关文章
相似问题
腾讯云开发者

Copyright © 2013 - 2026 Tencent Cloud. All Rights Reserved. 腾讯云 版权所有
深圳市腾讯计算机系统有限公司 ICP备案/许可证号:粤B2-20090059 ![]() 粤公网安备44030502008569号
粤公网安备44030502008569号
腾讯云计算(北京)有限责任公司 京ICP证150476号 | 京ICP备11018762号