
R ggplot2:基于条件/数值阈值的颜色分组条形图
R ggplot2:基于条件/数值阈值的颜色分组条形图
提问于 2016-08-04 20:43:16
对于使用ggplot2生成的分组条形图,我有以下输入:
Disease;Category;Value;pValue
Disease A;Count;100;0.0001
Disease A;Expected Count;50;0.0001
Disease B;Count;80;0.0005
Disease B;Expected Count;40;0.0005
Disease C;Count;60;0.0010
Disease C;Expected Count;40;0.0010
Disease D;Count;45;0.05
Disease D;Expected Count;50;0.05
下面的代码生成分组桶形图:
literature.disease2 <- read.table(file = "/user/literature-disease2.csv",sep=";", header=TRUE)
literature.disease2.sorted <- literature.disease2[order(literature.disease2$pValue,literature.disease2$Category),]
ggplot(data=literature.disease2.sorted, aes(x=Disease, y=Value, fill=Category)) +
geom_bar(stat="identity", position=position_dodge(),size=.3, colour="black") +
  scale_fill_manual(values=c("Count" = "lightblue", "Expected Count" = "pink")) + # Change color
  xlab("Disease Category") + ylab("Literature Count") + # Set axis labels
  ggtitle("Genome-Wide Literature Counts") +     # Set title
  theme_bw() +
  theme(axis.text.x = element_text(angle =90, hjust = 1,vjust=0.5))
这就是情节:
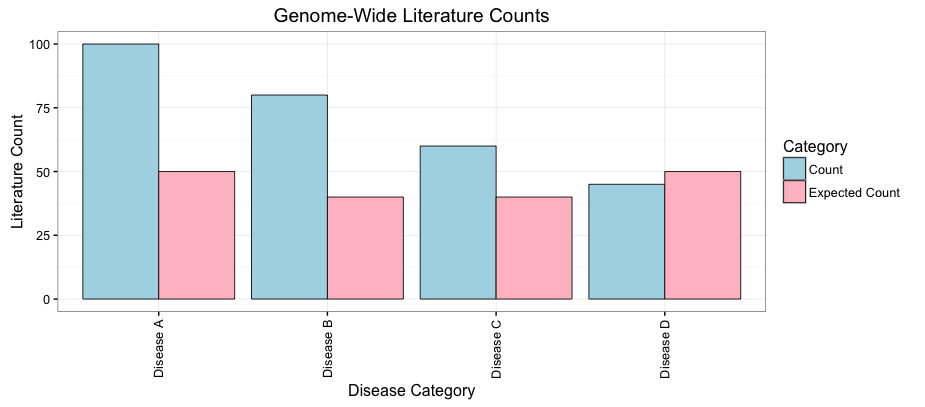
现在,每当pValue <= 0.005时,我想用蓝色(而不是浅蓝色)和紫色(而不是粉红色)把条子涂成颜色。我知道我必须更改scale_fill_manual选项,但我不知道如何对分组条形图这样做。有人能帮忙吗?
谢谢你,弗兰克
回答 1
Stack Overflow用户
回答已采纳
发布于 2016-08-04 20:49:55
这段代码可能会让您开始工作,但请考虑将重要性添加为例如alpha美学,而不是双重编码。
关键是使用interaction()作为fill美学,并适当地映射颜色。
library(ggplot2)
literature.disease2 <- read.table(text = "Disease;Category;Value;pValue
Disease A;Count;100;0.0001
Disease A;Expected Count;50;0.0001
Disease B;Count;80;0.0005
Disease B;Expected Count;40;0.0005
Disease C;Count;60;0.0010
Disease C;Expected Count;40;0.0010
Disease D;Count;45;0.05
Disease D;Expected Count;50;0.05",sep=";", header=TRUE)
literature.disease2.sorted <- literature.disease2[order(literature.disease2$pValue,literature.disease2$Category),]
ggplot(data=literature.disease2.sorted, aes(x=Disease, y=Value, fill=interaction(Category, pValue <= .005))) +
  geom_bar(stat="identity", position=position_dodge(),size=.3, colour="black") +
  scale_fill_manual(values=c("Count.FALSE" = "lightblue", "Count.TRUE" = "blue", "Expected Count.FALSE" = "pink", "Expected Count.TRUE" = "purple")) + # Change color
  xlab("Disease Category") + ylab("Literature Count") + # Set axis labels
  ggtitle("Genome-Wide Literature Counts") +     # Set title
  theme_bw() +
  theme(axis.text.x = element_text(angle =90, hjust = 1,vjust=0.5))
下面是我的建议:
ggplot(data=literature.disease2.sorted, aes(x=Disease, y=Value, fill=Category, alpha = pValue <= .005)) +
  geom_bar(stat="identity", position=position_dodge(),size=.3, colour="black") +
  scale_fill_manual(values=c("Count" = "blue", "Expected Count" = "purple")) + # Change color
  scale_alpha_discrete(range = c(0.5, 1)) + # Make the "insignificant" bars a little more visible (default range = c(0.1,1))
  xlab("Disease Category") + ylab("Literature Count") + # Set axis labels
  ggtitle("Genome-Wide Literature Counts") +     # Set title
  theme_bw() +
theme(axis.text.x = element_text(angle =90, hjust = 1,vjust=0.5)) 页面原文内容由Stack Overflow提供。腾讯云小微IT领域专用引擎提供翻译支持
原文链接:
https://stackoverflow.com/questions/38777085
复制相关文章
相似问题
腾讯云开发者

Copyright © 2013 - 2026 Tencent Cloud. All Rights Reserved. 腾讯云 版权所有
深圳市腾讯计算机系统有限公司 ICP备案/许可证号:粤B2-20090059 ![]() 粤公网安备44030502008569号
粤公网安备44030502008569号
腾讯云计算(北京)有限责任公司 京ICP证150476号 | 京ICP备11018762号