
利用Telerik RadHtmlChart在线路图上开发下钻功能
利用Telerik RadHtmlChart在线路图上开发下钻功能
提问于 2016-08-03 11:33:15
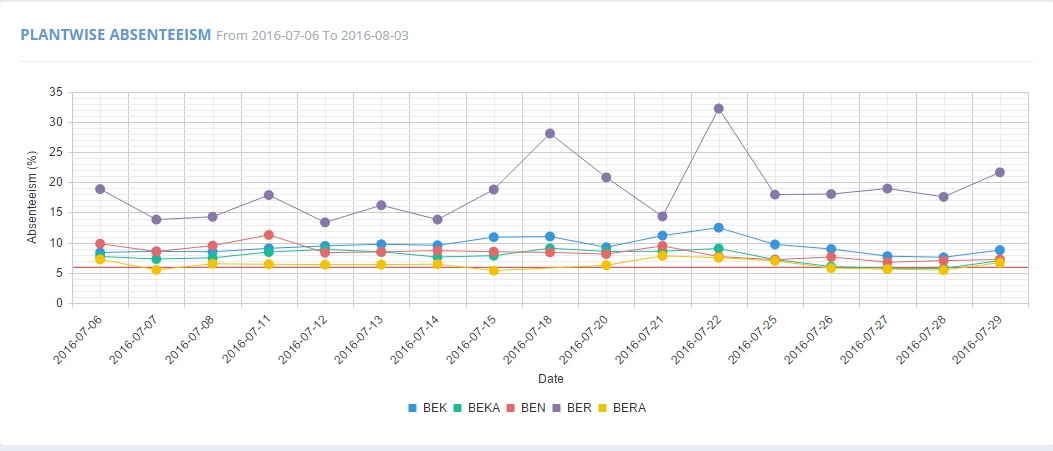
我正在使用RadHtmlChart控件显示几个生产工厂每天缺勤的情况。我使用的是线系列元素,每个工厂都有自己的一个。每个生产工厂有许多部门,每个部门有许多指定。当我点击一个特定的工厂时,我应该能够得到属于我选择的特定工厂的部门级别的详细信息。同样,当我进一步钻研时,也会得到选定部门的名称(在我选择的工厂内)。
我使用了以下示例:http://demos.telerik.com/aspnet-ajax/htmlchart/examples/drilldownchart/defaultcs.aspx
这是一个列图表,它没有告诉我如何识别选定的趋势线。
string seriesName = RadHtmlChart1.PlotArea.Series[0].Name;我不需要在第0索引处获取LineSeries的名称,而是要得到所选LineSeries的名称。
HTML代码:
<%@ Page Title="" Language="C#" MasterPageFile="~/MasterPage.master" AutoEventWireup="true" CodeFile="HRTrends.aspx.cs" Inherits="HRTrends" %>
<asp:Content ID="Content1" ContentPlaceHolderID="ContentPlaceHolder_Title" runat="Server">
</asp:Content>
<asp:Content ID="Content2" ContentPlaceHolderID="ContentPlaceHolder_PageTitle" runat="Server">
</asp:Content>
<asp:Content ID="Content3" ContentPlaceHolderID="ContentPlaceHolder_PageSubTitle" runat="Server">
</asp:Content>
<asp:Content ID="Content4" ContentPlaceHolderID="ContentPlaceHolder_BreadCrumb2" runat="Server">
</asp:Content>
<asp:Content ID="Content5" ContentPlaceHolderID="ContentPlaceHolder_BreadCrumb3" runat="Server">
</asp:Content>
<asp:Content ID="Content6" ContentPlaceHolderID="ContentPlaceHolder_PageContent" runat="Server">
<div class="row">
<div class="col-md-12 col-sm-12">
<!-- BEGIN PORTLET-->
<div class="portlet light ">
<div class="portlet-title">
<div class="caption caption-md">
<i class="icon-bar-chart theme-font-color hide"></i>
<span class="caption-subject theme-font-color bold uppercase">Date Range</span>
<span class="caption-helper"></span>
</div>
<div class="actions">
</div>
</div>
<div class="portlet-body">
<div class="row">
<div class="col-md-4">
<div class="col-md-12">
<div class="col-md-4">
<p class="text-left">From Date:</p>
</div>
<div class="col-md-8">
<telerik:RadDatePicker ID="RadDatePicker_StartDate" runat="server" Width="90%"></telerik:RadDatePicker>
<asp:RequiredFieldValidator ID="RequiredFieldValidator_RadDatePicker_StartDate" runat="server" ErrorMessage="*" ControlToValidate="RadDatePicker_StartDate" ValidationGroup="g1" ForeColor="Red"></asp:RequiredFieldValidator>
</div>
</div>
</div>
<div class="col-md-4">
<div class="col-md-12">
<div class="col-md-4">
<p class="text-left">To Date:</p>
</div>
<div class="col-md-8">
<telerik:RadDatePicker ID="RadDatePicker_EndDate" runat="server" Width="90%"></telerik:RadDatePicker>
<asp:RequiredFieldValidator ID="RequiredFieldValidator_RadDatePicker_EndDate" runat="server" ErrorMessage="*" ControlToValidate="RadDatePicker_EndDate" ValidationGroup="g1" ForeColor="Red"></asp:RequiredFieldValidator>
</div>
</div>
</div>
<div class="col-md-4">
<button id="Button_ApplyDateRange" runat="server" class="btn blue btn-block" validationgroup="g1" onserverclick="Button_ApplyDateRange_OnClick">Apply Date Range</button>
</div>
</div>
<div class="row">
<div class="alert alert-danger" style="margin: 10px 0px 5px 0px;" runat="server" id="Div_Error">
<strong>Error!</strong>
<asp:Label ID="Label_DateRange" runat="server" Text="Label" Visible="false"></asp:Label>
</div>
</div>
</div>
</div>
</div>
</div>
<%--Absenteeism--%>
<div class="row">
<div class="col-md-12 col-sm-12">
<!-- BEGIN PORTLET-->
<div class="portlet light ">
<div class="portlet-title">
<div class="caption caption-md">
<i class="icon-bar-chart theme-font-color hide"></i>
<span class="caption-subject theme-font-color bold uppercase">Plantwise Absenteeism</span>
<span class="caption-helper">
<asp:Label ID="Label_Absenteeism" runat="server" Text="Label"></asp:Label>
</span>
</div>
<div class="actions">
</div>
</div>
<div class="portlet-body">
<telerik:RadCodeBlock ID="codeBlock" runat="server">
<script type="text/javascript">
function OnClientSeriesClicked(sender, args) {
if ((args.get_seriesName() != "BEK1") && (args.get_seriesName() != "BEKA1") && (args.get_seriesName() != "BEN1") && (args.get_seriesName() != "BER1") && (args.get_seriesName() != "BERA1"))
$find("<%= RadAjaxManager_PlantSummary_Absenteeism.ClientID %>").ajaxRequest(args.get_category());
}
</script>
</telerik:RadCodeBlock>
<telerik:RadAjaxManager ID="RadAjaxManager_PlantSummary_Absenteeism" runat="server" OnAjaxRequest="RadAjaxManager_PlantSummary_Absenteeism_AjaxRequest">
<AjaxSettings>
<telerik:AjaxSetting AjaxControlID="RadAjaxManager1">
<UpdatedControls>
<telerik:AjaxUpdatedControl ControlID="RadHtmlChart_PlantSummary_Absenteeism" LoadingPanelID="LoadingPanel_PlantSummary_Absenteeism"></telerik:AjaxUpdatedControl>
</UpdatedControls>
</telerik:AjaxSetting>
</AjaxSettings>
</telerik:RadAjaxManager>
<telerik:RadAjaxLoadingPanel ID="LoadingPanel_PlantSummary_Absenteeism" runat="server">
</telerik:RadAjaxLoadingPanel>
<telerik:RadHtmlChart ID="RadHtmlChart_PlantSummary_Absenteeism" runat="server" Height="350px" Width="100%" Skin="Bootstrap" DataSourceID="SqlDataSource_PlantSummary_Absenteeism" OnClientSeriesClicked="OnClientSeriesClicked">
<Legend>
<Appearance BackgroundColor="White" Position="Bottom">
</Appearance>
</Legend>
<PlotArea>
<Series>
<telerik:LineSeries DataFieldY="BEK" Name="BEK">
<Appearance>
<FillStyle BackgroundColor="#3598DC" />
</Appearance>
<MarkersAppearance BackgroundColor="#3598DC" />
<LabelsAppearance Visible="false"></LabelsAppearance>
</telerik:LineSeries>
<telerik:LineSeries DataFieldY="BEKA" Name="BEKA">
<Appearance>
<FillStyle BackgroundColor="#1BBC9B" />
</Appearance>
<MarkersAppearance BackgroundColor="#1BBC9B" />
<LabelsAppearance Visible="false"></LabelsAppearance>
</telerik:LineSeries>
<telerik:LineSeries DataFieldY="BEN" Name="BEN">
<Appearance>
<FillStyle BackgroundColor="#E26A6A" />
</Appearance>
<MarkersAppearance BackgroundColor="#E26A6A" />
<LabelsAppearance Visible="false"></LabelsAppearance>
</telerik:LineSeries>
<telerik:LineSeries DataFieldY="BER" Name="BER">
<Appearance>
<FillStyle BackgroundColor="#8877a9" />
</Appearance>
<MarkersAppearance BackgroundColor="#8877a9" />
<LabelsAppearance Visible="false"></LabelsAppearance>
</telerik:LineSeries>
<telerik:LineSeries DataFieldY="BERA" Name="BERA">
<Appearance>
<FillStyle BackgroundColor="#F3C200" />
</Appearance>
<MarkersAppearance BackgroundColor="#F3C200" />
<LabelsAppearance Visible="false"></LabelsAppearance>
</telerik:LineSeries>
</Series>
<XAxis DataLabelsField="Date">
<LabelsAppearance RotationAngle="-45">
</LabelsAppearance>
<TitleAppearance Text="Date">
<TextStyle FontSize="12Px" />
</TitleAppearance>
</XAxis>
<YAxis>
<TitleAppearance Text="Absenteeism (%)">
<TextStyle FontSize="12Px" />
</TitleAppearance>
<PlotBands>
<telerik:PlotBand From="5.8" To="6" Color="#CC0000" Alpha="90" />
</PlotBands>
</YAxis>
</PlotArea>
</telerik:RadHtmlChart>
<asp:SqlDataSource ID="SqlDataSource_PlantSummary_Absenteeism" runat="server" ConnectionString="<%$ ConnectionStrings:OperationsDBConnectionString %>" SelectCommand="SP_Get_VHRD_Designation_Wise_History_PlantSummary_Absenteeism" SelectCommandType="StoredProcedure">
<SelectParameters>
<asp:Parameter Name="StartDate" Type="DateTime" />
<asp:Parameter Name="EndDate" Type="DateTime" />
</SelectParameters>
</asp:SqlDataSource>
</div>
</div>
<!-- END PORTLET-->
</div>
</div>
<%--LTO--%>
<div class="row">
<div class="col-md-12 col-sm-12">
<!-- BEGIN PORTLET-->
<div class="portlet light ">
<div class="portlet-title">
<div class="caption caption-md">
<i class="icon-bar-chart theme-font-color hide"></i>
<span class="caption-subject theme-font-color bold uppercase">Plantwise LTO</span>
<span class="caption-helper">
<asp:Label ID="Label_LTOP" runat="server" Text="Label"></asp:Label>
</span>
</div>
<div class="actions">
</div>
</div>
<div class="portlet-body">
<telerik:RadHtmlChart ID="RadHtmlChart_PlantSummary_LTOP" runat="server" Height="350px" Width="100%" Skin="Bootstrap" DataSourceID="SqlDataSource_PlantSummary_LTOP">
<Legend>
<Appearance BackgroundColor="White" Position="Bottom">
</Appearance>
</Legend>
<PlotArea>
<Series>
<telerik:LineSeries DataFieldY="BEK" Name="BEK">
<Appearance>
<FillStyle BackgroundColor="#3598DC" />
</Appearance>
<MarkersAppearance BackgroundColor="#3598DC" />
<LabelsAppearance Visible="false"></LabelsAppearance>
</telerik:LineSeries>
<telerik:LineSeries DataFieldY="BEKA" Name="BEKA">
<Appearance>
<FillStyle BackgroundColor="#1BBC9B" />
</Appearance>
<MarkersAppearance BackgroundColor="#1BBC9B" />
<LabelsAppearance Visible="false"></LabelsAppearance>
</telerik:LineSeries>
<telerik:LineSeries DataFieldY="BEN" Name="BEN">
<Appearance>
<FillStyle BackgroundColor="#E26A6A" />
</Appearance>
<MarkersAppearance BackgroundColor="#E26A6A" />
<LabelsAppearance Visible="false"></LabelsAppearance>
</telerik:LineSeries>
<telerik:LineSeries DataFieldY="BER" Name="BER">
<Appearance>
<FillStyle BackgroundColor="#8877a9" />
</Appearance>
<MarkersAppearance BackgroundColor="#8877a9" />
<LabelsAppearance Visible="false"></LabelsAppearance>
</telerik:LineSeries>
<telerik:LineSeries DataFieldY="BERA" Name="BERA">
<Appearance>
<FillStyle BackgroundColor="#F3C200" />
</Appearance>
<MarkersAppearance BackgroundColor="#F3C200" />
<LabelsAppearance Visible="false"></LabelsAppearance>
</telerik:LineSeries>
</Series>
<XAxis DataLabelsField="Date">
<LabelsAppearance RotationAngle="-45">
</LabelsAppearance>
<TitleAppearance Text="Date">
<TextStyle FontSize="12Px" />
</TitleAppearance>
</XAxis>
<YAxis>
<TitleAppearance Text="LTO (%)">
<TextStyle FontSize="12Px" />
</TitleAppearance>
<PlotBands>
<telerik:PlotBand From="2.9" To="3" Color="#CC0000" Alpha="190" />
</PlotBands>
</YAxis>
</PlotArea>
</telerik:RadHtmlChart>
<asp:SqlDataSource ID="SqlDataSource_PlantSummary_LTOP" runat="server" ConnectionString="<%$ ConnectionStrings:OperationsDBConnectionString %>" SelectCommand="SP_Get_VHRD_Designation_Wise_History_PlantSummary_LTO" SelectCommandType="StoredProcedure">
<SelectParameters>
<asp:Parameter Name="StartDate" Type="DateTime" />
<asp:Parameter Name="EndDate" Type="DateTime" />
</SelectParameters>
</asp:SqlDataSource>
</div>
</div>
<!-- END PORTLET-->
</div>
</div>
<%--Recruitment--%>
<div class="row">
<div class="col-md-12 col-sm-12">
<!-- BEGIN PORTLET-->
<div class="portlet light ">
<div class="portlet-title">
<div class="caption caption-md">
<i class="icon-bar-chart theme-font-color hide"></i>
<span class="caption-subject theme-font-color bold uppercase">Plantwise Recruitments</span>
<span class="caption-helper">
<asp:Label ID="Label_Recruitment" runat="server" Text="Label"></asp:Label>
</span>
</div>
<div class="actions">
</div>
</div>
<div class="portlet-body">
<telerik:RadHtmlChart ID="RadHtmlChart_PlantSummary_Recruitment" runat="server" Height="350px" Width="100%" Skin="Bootstrap" DataSourceID="SqlDataSource_PlantSummary_Recruitments">
<Legend>
<Appearance BackgroundColor="White" Position="Bottom">
</Appearance>
</Legend>
<PlotArea>
<Series>
<telerik:LineSeries DataFieldY="BEK" Name="BEK">
<Appearance>
<FillStyle BackgroundColor="#3598DC" />
</Appearance>
<MarkersAppearance BackgroundColor="#3598DC" />
<LabelsAppearance Visible="false"></LabelsAppearance>
</telerik:LineSeries>
<telerik:LineSeries DataFieldY="BEKA" Name="BEKA">
<Appearance>
<FillStyle BackgroundColor="#1BBC9B" />
</Appearance>
<MarkersAppearance BackgroundColor="#1BBC9B" />
<LabelsAppearance Visible="false"></LabelsAppearance>
</telerik:LineSeries>
<telerik:LineSeries DataFieldY="BEN" Name="BEN">
<Appearance>
<FillStyle BackgroundColor="#E26A6A" />
</Appearance>
<MarkersAppearance BackgroundColor="#E26A6A" />
<LabelsAppearance Visible="false"></LabelsAppearance>
</telerik:LineSeries>
<telerik:LineSeries DataFieldY="BER" Name="BER">
<Appearance>
<FillStyle BackgroundColor="#8877a9" />
</Appearance>
<MarkersAppearance BackgroundColor="#8877a9" />
<LabelsAppearance Visible="false"></LabelsAppearance>
</telerik:LineSeries>
<telerik:LineSeries DataFieldY="BERA" Name="BERA">
<Appearance>
<FillStyle BackgroundColor="#F3C200" />
</Appearance>
<MarkersAppearance BackgroundColor="#F3C200" />
<LabelsAppearance Visible="false"></LabelsAppearance>
</telerik:LineSeries>
</Series>
<XAxis DataLabelsField="Date">
<LabelsAppearance RotationAngle="-45">
</LabelsAppearance>
<TitleAppearance Text="Date">
<TextStyle FontSize="12Px" />
</TitleAppearance>
</XAxis>
<YAxis>
<TitleAppearance Text="Recruitment (Number of People)">
<TextStyle FontSize="12Px" />
</TitleAppearance>
</YAxis>
</PlotArea>
</telerik:RadHtmlChart>
<asp:SqlDataSource ID="SqlDataSource_PlantSummary_Recruitments" runat="server" ConnectionString="<%$ ConnectionStrings:OperationsDBConnectionString %>" SelectCommand="SP_Get_VHRD_Designation_Wise_History_PlantSummary_Recruitment" SelectCommandType="StoredProcedure">
<SelectParameters>
<asp:Parameter Name="StartDate" Type="DateTime" />
<asp:Parameter Name="EndDate" Type="DateTime" />
</SelectParameters>
</asp:SqlDataSource>
</div>
</div>
<!-- END PORTLET-->
</div>
</div>
<%--Actuals--%>
<div class="row">
<div class="col-md-12 col-sm-12">
<!-- BEGIN PORTLET-->
<div class="portlet light ">
<div class="portlet-title">
<div class="caption caption-md">
<i class="icon-bar-chart theme-font-color hide"></i>
<span class="caption-subject theme-font-color bold uppercase">Plantwise Actuals</span>
<span class="caption-helper">
<asp:Label ID="Label_Actuals" runat="server" Text="Label"></asp:Label>
</span>
</div>
<div class="actions">
</div>
</div>
<div class="portlet-body">
<telerik:RadHtmlChart ID="RadHtmlChart_PlantSummary_Actuals" runat="server" Height="350px" Width="100%" Skin="Bootstrap" DataSourceID="SqlDataSource_PlantSummary_Actuals">
<Legend>
<Appearance BackgroundColor="White" Position="Bottom">
</Appearance>
</Legend>
<PlotArea>
<Series>
<telerik:LineSeries DataFieldY="BEK" Name="BEK">
<Appearance>
<FillStyle BackgroundColor="#3598DC" />
</Appearance>
<MarkersAppearance BackgroundColor="#3598DC" />
<LabelsAppearance Visible="false"></LabelsAppearance>
</telerik:LineSeries>
<telerik:LineSeries DataFieldY="BEKA" Name="BEKA">
<Appearance>
<FillStyle BackgroundColor="#1BBC9B" />
</Appearance>
<MarkersAppearance BackgroundColor="#1BBC9B" />
<LabelsAppearance Visible="false"></LabelsAppearance>
</telerik:LineSeries>
<telerik:LineSeries DataFieldY="BEN" Name="BEN">
<Appearance>
<FillStyle BackgroundColor="#E26A6A" />
</Appearance>
<MarkersAppearance BackgroundColor="#E26A6A" />
<LabelsAppearance Visible="false"></LabelsAppearance>
</telerik:LineSeries>
<telerik:LineSeries DataFieldY="BER" Name="BER">
<Appearance>
<FillStyle BackgroundColor="#8877a9" />
</Appearance>
<MarkersAppearance BackgroundColor="#8877a9" />
<LabelsAppearance Visible="false"></LabelsAppearance>
</telerik:LineSeries>
<telerik:LineSeries DataFieldY="BERA" Name="BERA">
<Appearance>
<FillStyle BackgroundColor="#F3C200" />
</Appearance>
<MarkersAppearance BackgroundColor="#F3C200" />
<LabelsAppearance Visible="false"></LabelsAppearance>
</telerik:LineSeries>
</Series>
<XAxis DataLabelsField="Date">
<LabelsAppearance RotationAngle="-45">
</LabelsAppearance>
<TitleAppearance Text="Date">
<TextStyle FontSize="12Px" />
</TitleAppearance>
</XAxis>
<YAxis>
<TitleAppearance Text="Actuals (Number of People)">
<TextStyle FontSize="12Px" />
</TitleAppearance>
</YAxis>
</PlotArea>
</telerik:RadHtmlChart>
<asp:SqlDataSource ID="SqlDataSource_PlantSummary_Actuals" runat="server" ConnectionString="<%$ ConnectionStrings:OperationsDBConnectionString %>" SelectCommand="SP_Get_VHRD_Designation_Wise_History_PlantSummary_Actuals" SelectCommandType="StoredProcedure">
<SelectParameters>
<asp:Parameter Name="StartDate" Type="DateTime" />
<asp:Parameter Name="EndDate" Type="DateTime" />
</SelectParameters>
</asp:SqlDataSource>
</div>
</div>
<!-- END PORTLET-->
</div>
</div>
</asp:Content>
代码背后:
using System;

public partial class HRTrends : System.Web.UI.Page
{
    private DatabaseConnect db = new DatabaseConnect();

    protected void Page_Load(object sender, EventArgs e)
    {
        if (!IsPostBack)
        {
            DateTime today = DateTime.Today.AddMonths(-1);

            DateTime startDateDT = new DateTime(today.Year, today.Month, 1);
            string startDate = startDateDT.ToString("yyyy-MM-dd");

            DateTime endDate_DT = startDateDT.AddMonths(1).AddDays(-1);
            string endDate = endDate_DT.ToString("yyyy-MM-dd");

            SetUpDates(startDate, endDate);
        }
        Label_DateRange.Visible = false;
        Div_Error.Visible = false;
    }

    private void SetUpDates(string startDate, string endDate)
    {
        string dateMessage = "From " + startDate + " To " + endDate;

        SqlDataSource_PlantSummary_Actuals.SelectParameters[0].DefaultValue = startDate;
        SqlDataSource_PlantSummary_Actuals.SelectParameters[1].DefaultValue = endDate;

        SqlDataSource_PlantSummary_Absenteeism.SelectParameters[0].DefaultValue = startDate;
        SqlDataSource_PlantSummary_Absenteeism.SelectParameters[1].DefaultValue = endDate;

        SqlDataSource_PlantSummary_LTOP.SelectParameters[0].DefaultValue = startDate;
        SqlDataSource_PlantSummary_LTOP.SelectParameters[1].DefaultValue = endDate;

        SqlDataSource_PlantSummary_Recruitments.SelectParameters[0].DefaultValue = startDate;
        SqlDataSource_PlantSummary_Recruitments.SelectParameters[1].DefaultValue = endDate;

        Label_Actuals.Text = dateMessage;
        Label_Absenteeism.Text = dateMessage;
        Label_LTOP.Text = dateMessage;
        Label_Recruitment.Text = dateMessage;
    }

    protected void Button_ApplyDateRange_OnClick(object sender, EventArgs e)
    {
        if (IsValid)
        {
            if (RadDatePicker_StartDate.SelectedDate <= RadDatePicker_EndDate.SelectedDate)
            {
                string startDate = RadDatePicker_StartDate.SelectedDate.Value.ToString("yyyy-MM-dd");
                string endDate = RadDatePicker_EndDate.SelectedDate.Value.ToString("yyyy-MM-dd");

                SetUpDates(startDate, endDate);
            }
            else
            {
                Label_DateRange.Text = "You have selected an invalid date range. Please select a valid date range.";
                Label_DateRange.Visible = true;
                Div_Error.Visible = true;
            }
        }
    }
    protected void RadAjaxManager_PlantSummary_Absenteeism_AjaxRequest(object sender, Telerik.Web.UI.AjaxRequestEventArgs e)
    {
        string seriesName = RadHtmlChart_PlantSummary_Absenteeism.PlotArea.Series[0].Name;
    }
}回答 1
Stack Overflow用户
回答已采纳
发布于 2016-08-09 08:28:07
向下钻取是从客户端代码启动的,因此您可以从seriesClick事件的事件参数中获得单击的系列(您的代码片段已经这样做了)。
 function OnClientSeriesClicked(sender, args) {
                    alert(args.get_seriesName())
                  }
以及设置标记的位置。
<telerik:RadHtmlChart ID="RadHtmlChart_PlantSummary_Absenteeism" runat="server" Height="350px" Width="100%" Skin="Bootstrap" DataSourceID="SqlDataSource_PlantSummary_Absenteeism" OnClientSeriesClicked="OnClientSeriesClicked">页面原文内容由Stack Overflow提供。腾讯云小微IT领域专用引擎提供翻译支持
原文链接:
https://stackoverflow.com/questions/38742388
复制相关文章
相似问题
腾讯云开发者

Copyright © 2013 - 2026 Tencent Cloud. All Rights Reserved. 腾讯云 版权所有
深圳市腾讯计算机系统有限公司 ICP备案/许可证号:粤B2-20090059 ![]() 粤公网安备44030502008569号
粤公网安备44030502008569号
腾讯云计算(北京)有限责任公司 京ICP证150476号 | 京ICP备11018762号