
如何使用python绘制两条斜坡的线?
如何使用python绘制两条斜坡的线?
提问于 2016-08-02 18:15:45
我正在用下面的代码绘制两个斜坡的线,如picture.The斜率应该在一定的极限limit=5后应该下降。我正在用矢量化方法设置坡度values.Is,还有其他方法来设置斜坡values.Could,有人在这方面帮我吗?
                import matplotlib.pyplot as plt
                import numpy as np

                #Setting the condition
                L=5 #Limit
                m=1 #Slope
                c=0 #Intercept

                x=np.linspace(0,10,1000)
                #Calculate the y value
                y=m*x+c

                #plot the line
                plt.plot(x,y)

                #Set the slope values using vectorisation
                m[(x<L)] = 1.0
                m[(x>L)] = 0.75

                # plot the line again
                plt.plot(x,y)

                #Display with grids
                plt.grid()
                plt.show()
回答 2
Stack Overflow用户
回答已采纳
发布于 2016-08-02 18:35:46
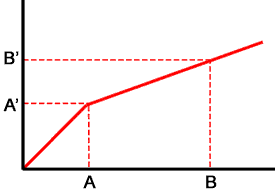
你可能考虑过了这个问题。图片中有两个线段:
- 从(0,0)到(A,A')
- 从(A,A')到(B,B')
你知道A = 5,m = 1,所以A' = 5。你也知道B = 10。考虑到(B' - A') / (B - A) = 0.75,我们有B' = 8.75。因此,您可以按以下方式制作该情节:
from matplotlib import pyplot as plt
m0 = 1
m1 = 0.75
x0 = 0 # Intercept
x1 = 5 # A
x2 = 10 # B
y0 = 0 # Intercept
y1 = y0 + m0 * (x1 - x0) # A'
y2 = y1 + m1 * (x2 - x1) # B'
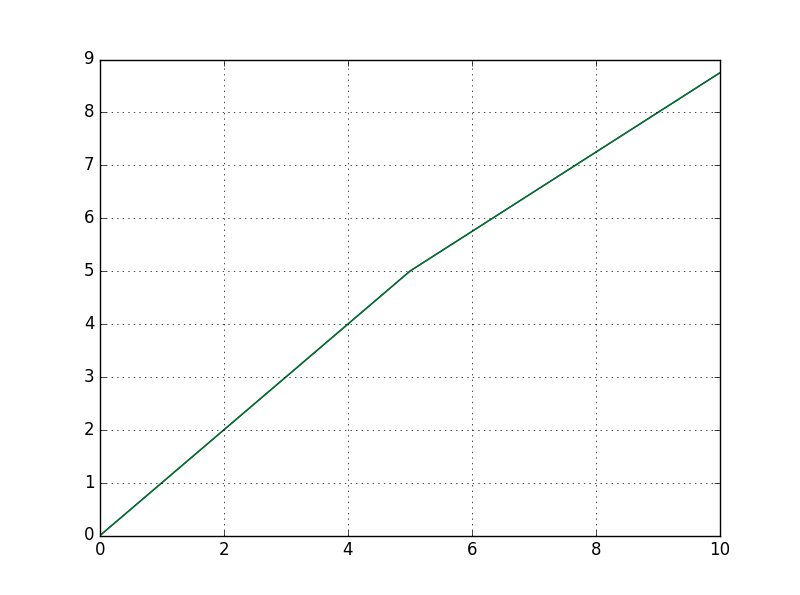
plt.plot([x0, x1, x2], [y0, y1, y2])希望您能看到计算给定限制集的y值的模式。结果如下:
现在,假设您确实想使用矢量化,因为一些不明确的原因。您可能想先计算所有y值,然后再绘制一次图,否则会得到奇怪的结果。下面是对原始代码的一些修改:
from matplotlib import pyplot as plt
import numpy as np

#Setting the condition
L = 5 #Limit
x = np.linspace(0, 10, 1000)
lMask = (x<=L)  # Avoid recomputing this mask

# Compute a vector of slope values for each x
m = np.zeros_like(x)
m[lMask] = 1.0
m[~lMask] = 0.75

# Compute the y-intercept for each segment
b = np.zeros_like(x)
#b[lMask] = 0.0   # Already set to zero, so skip this step
b[~lMask] = L * (m[0] - 0.75)

# Compute the y-vector
y = m * x + b

# plot the line again
plt.plot(x, y)

#Display with grids
plt.grid()
plt.show()
Stack Overflow用户
发布于 2016-08-02 18:35:45
按照您的代码,您应该修改主要部分如下:
x=np.linspace(0,10,1000)
m = np.empty(x.shape)
c = np.empty(x.shape)

m[(x<L)] = 1.0
c[x<L] = 0
m[(x>L)] = 0.75
c[x>L] = L*(1.0 - 0.75)

y=m*x+c
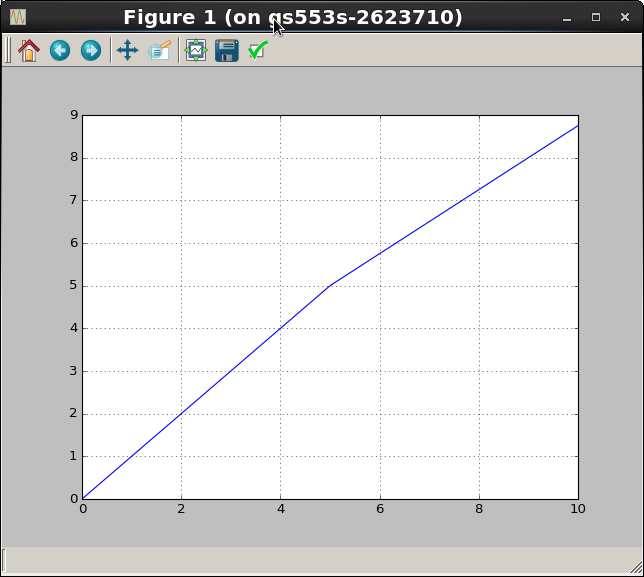
plt.plot(x,y)请注意,要使行连续,c也需要更改。其结果是:
页面原文内容由Stack Overflow提供。腾讯云小微IT领域专用引擎提供翻译支持
原文链接:
https://stackoverflow.com/questions/38727734
复制相关文章
相似问题
腾讯云开发者

Copyright © 2013 - 2026 Tencent Cloud. All Rights Reserved. 腾讯云 版权所有
深圳市腾讯计算机系统有限公司 ICP备案/许可证号:粤B2-20090059 ![]() 粤公网安备44030502008569号
粤公网安备44030502008569号
腾讯云计算(北京)有限责任公司 京ICP证150476号 | 京ICP备11018762号