
用plotrix绘制二项置信区间
用plotrix绘制二项置信区间
提问于 2016-07-27 10:06:04
我需要在我的情节中增加二项置信区间。
以下是我的步骤:
library(binom)
library(plotrix)
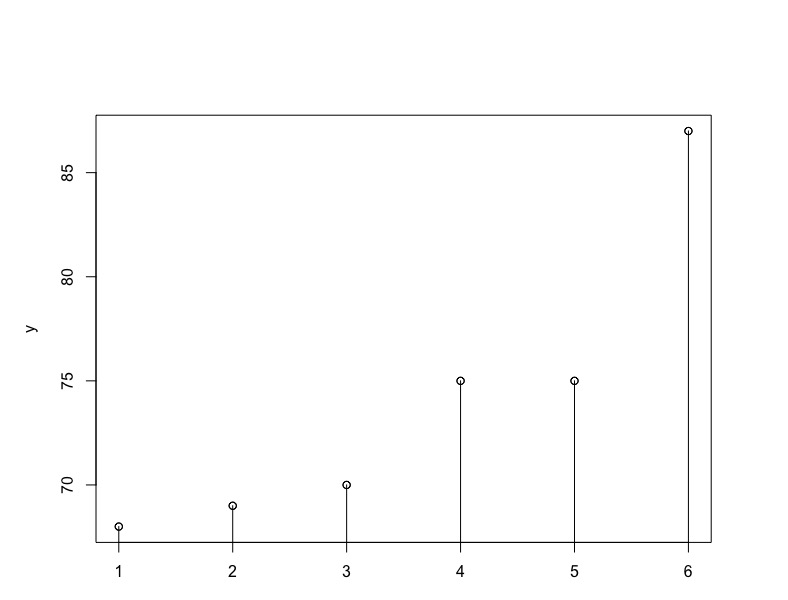
x <- c(1:6)
y <- c(68, 69, 70, 75, 75, 87)
CI <- binom.confint(y, 265, conf.level = 0.95, methods = "exact")
plot(x, y)
plotCI(x, y, ui = CI$upper, li = CI$lower, add = TRUE)我认为我做的每件事都是正确的,但我的输出图似乎不对:
你有什么建议吗?
回答 2
Stack Overflow用户
回答已采纳
发布于 2016-07-27 12:32:41
binom.confint返回比例的置信区间,而不是总数(如果您通过打印CI对象来检查它,您可能已经注意到了这一点)。试一试
plotCI(x,y,ui=CI$upper*CI$n,li=CI$lower*CI$n)(这结合了两个绘图语句来同时绘制点和错误条。)
或者,您可以绘制比例和它们的CIs:
plotCI(x,y/CI$n,ui=CI$upper,li=CI$lower)Stack Overflow用户
发布于 2016-07-27 11:02:45
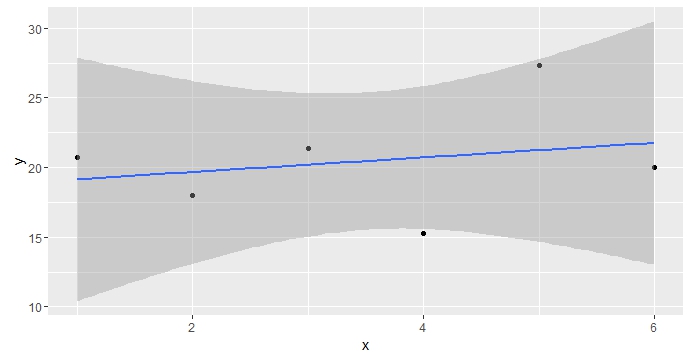
您考虑过使用ggplot2的选项了吗?
geom_smooth给出了线性模型("lm")预测的95%置信区间。
data<-data.frame(y=c(20.7, 18, 21.4, 15.3, 27.3, 20),x=c(1:6))
library(ggplot2)
g<-ggplot(data,aes(x,y))
g+geom_point()+geom_smooth(method="lm")
产出如下:
页面原文内容由Stack Overflow提供。腾讯云小微IT领域专用引擎提供翻译支持
原文链接:
https://stackoverflow.com/questions/38609870
复制相关文章
相似问题
腾讯云开发者

Copyright © 2013 - 2026 Tencent Cloud. All Rights Reserved. 腾讯云 版权所有
深圳市腾讯计算机系统有限公司 ICP备案/许可证号:粤B2-20090059 ![]() 粤公网安备44030502008569号
粤公网安备44030502008569号
腾讯云计算(北京)有限责任公司 京ICP证150476号 | 京ICP备11018762号