
Xmgrace:数据的绘图功能
Xmgrace:数据的绘图功能
提问于 2016-07-12 17:15:30
如何用xmgrace绘制数据函数?
假设我有一个3列文件,我想把第2列和第3列的和作为第1列的函数来绘制。有了gnuplot,我就可以
p "file.dat" u 1:($2+$3)我怎样才能用xmgrace做同样的事情呢?
回答 2
Stack Overflow用户
回答已采纳
发布于 2016-08-19 10:38:41
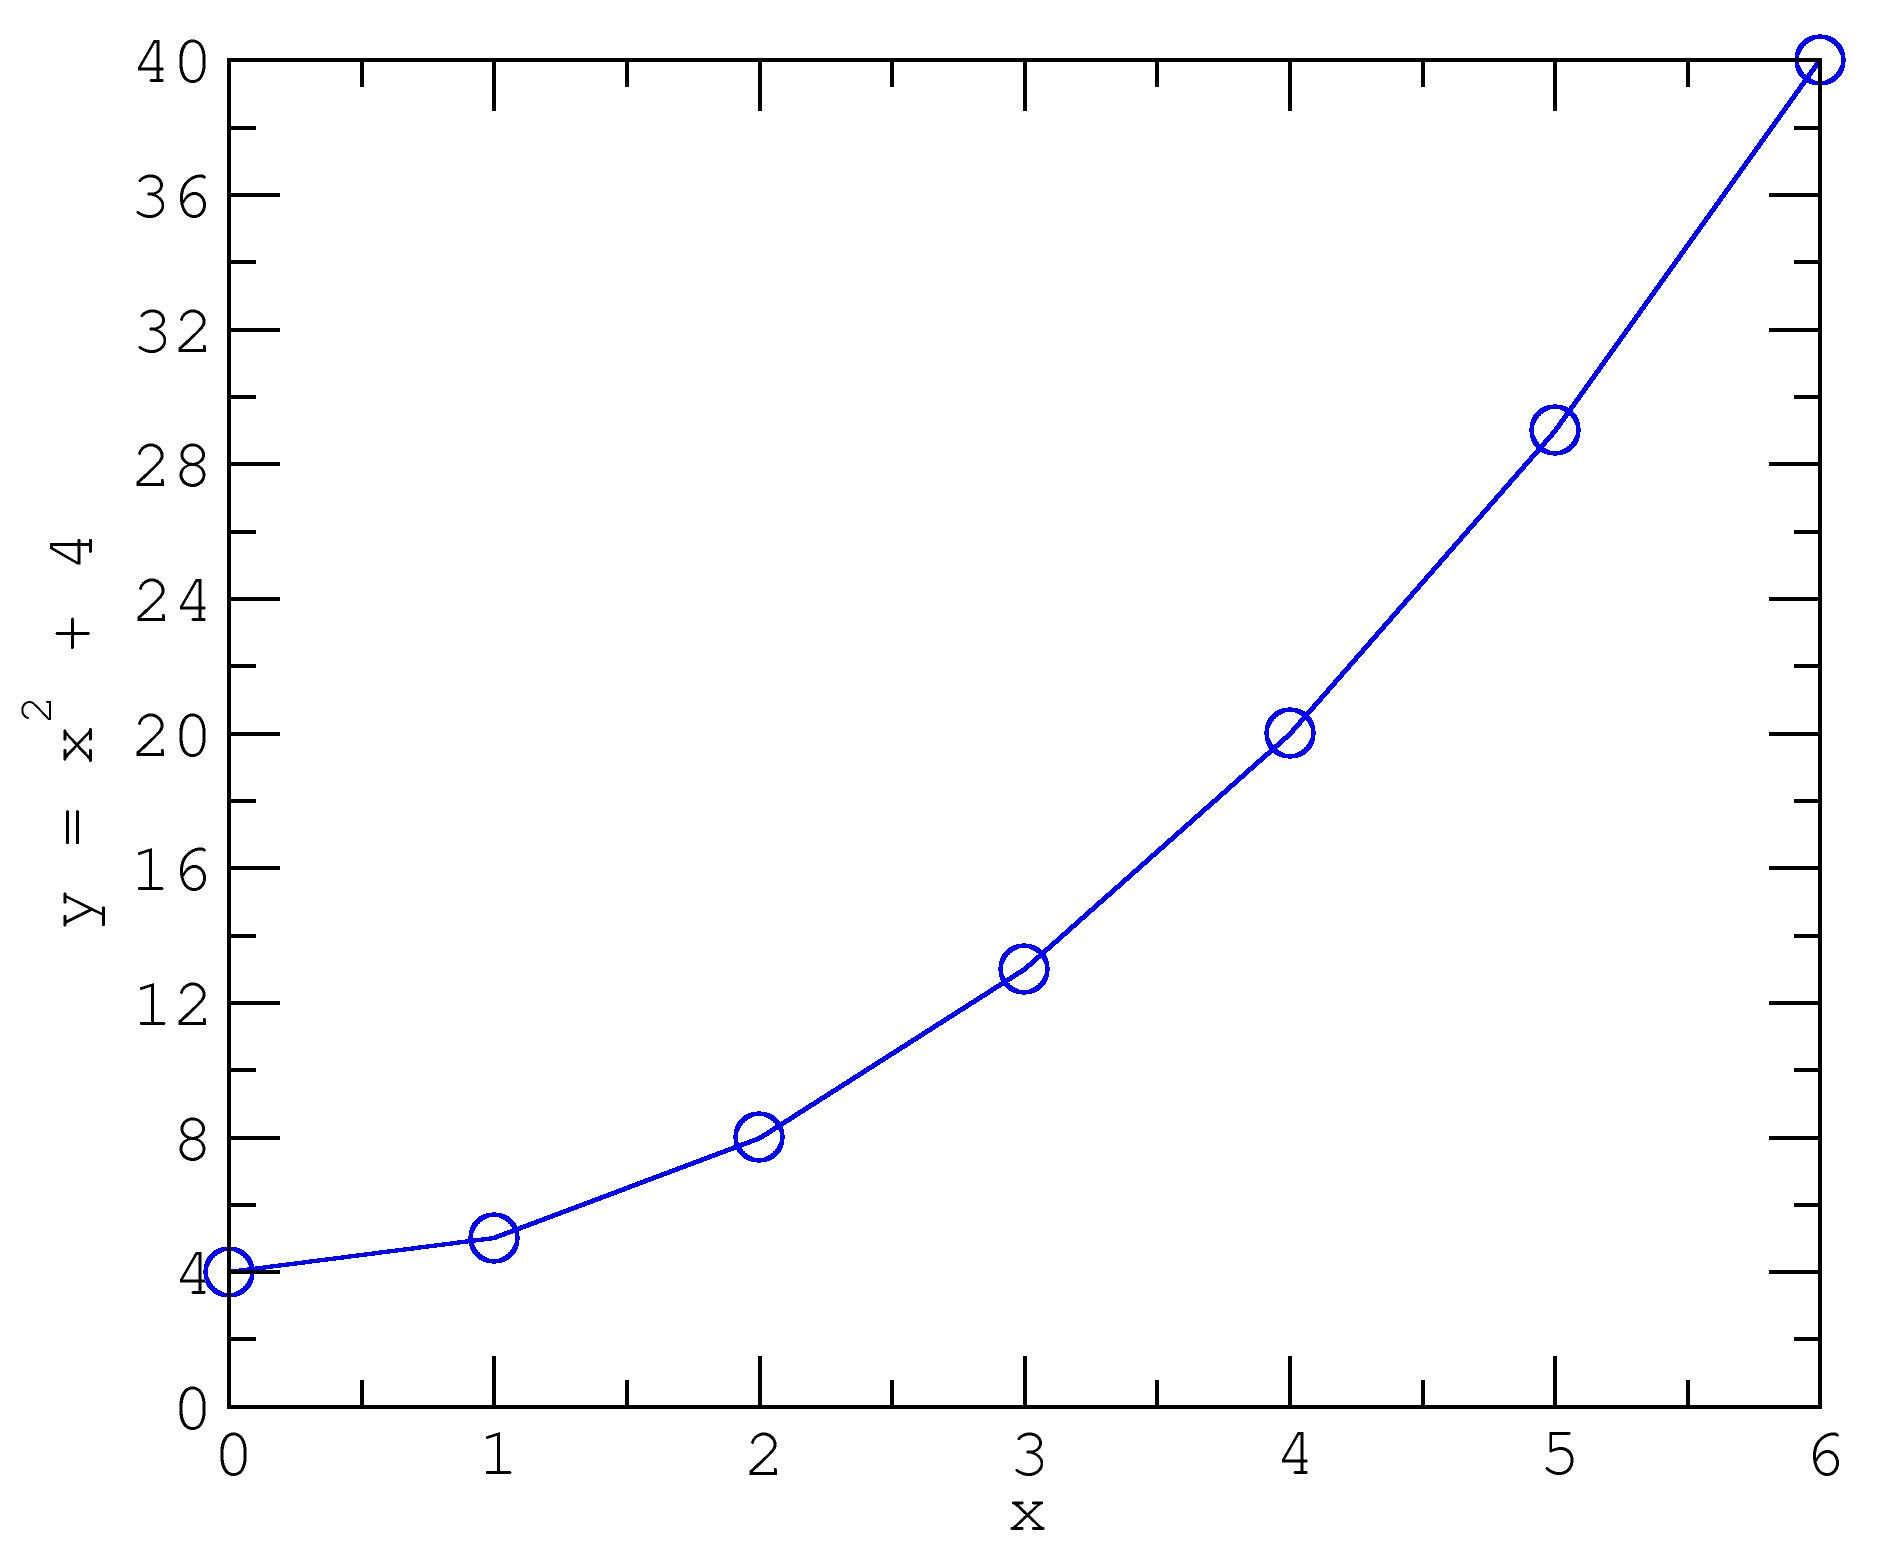
awk '{print $1, ($2 + $3)}' file.dat | xmgrace -pipe &示例:y= x^2 +4的绘图数据
file.dat含量
0 0 4
1 1 4
2 4 4
3 9 4
4 16 4
5 25 4
6 36 4
输出(修改样式后):
Stack Overflow用户
发布于 2016-09-19 20:45:16
一个纯优雅的解决方案是创建一个批处理文件(比如myplot.batch),该文件可以读取
READ BLOCK "file.dat"
BLOCK xy "1:2"
BLOCK xy "1:3"
s0.y=s0.y-s1.y
KILL s1
并使用
xmgrace -batch myplot.batch页面原文内容由Stack Overflow提供。腾讯云小微IT领域专用引擎提供翻译支持
原文链接:
https://stackoverflow.com/questions/38335230
复制相关文章
相似问题
腾讯云开发者

Copyright © 2013 - 2026 Tencent Cloud. All Rights Reserved. 腾讯云 版权所有
深圳市腾讯计算机系统有限公司 ICP备案/许可证号:粤B2-20090059 ![]() 粤公网安备44030502008569号
粤公网安备44030502008569号
腾讯云计算(北京)有限责任公司 京ICP证150476号 | 京ICP备11018762号