
R图颜色的
R图颜色的
提问于 2016-06-30 07:25:23
我试图创建一个sankey图,在R中使用了固定的节点和边缘颜色。这些颜色在.csv文件中以单独的颜色表示。
library(riverplot)

# import data
edges = read.csv("sankey_data_edges.csv")

nodes = read.csv("sankey_data_nodes.csv")


r <- makeRiver(nodes, edges)
plot( r )sankey_data_nodes.csv包含:
ID  x   labels  y   col
1   1   G1  2   green
2   1   G2  1   red
3   3   G3  3   red
4   3   G4  2   red
5   1   G5  6   red
6   1   G6  5   red
7   4   G7  6   red
8   2   G8  4   red
9   1   G9  3   red
10  1   G10 4   red
11  3   G11 6   red
12 3 G12 4 redsankey_data_edges.csv包含:
N1  N2  Value   col edgecol
5   4   0.098870056 yellow  col
1   11  0.124105534 red col
5   3   0.163841808 red col
2   11  0.175207813 red col
10  8   0.214996976 red col
5   12  0.330508475 red col
5   11  0.406779661 red col
9   8   0.485689676 red col
8   11  0.700686653 red col
11  7   1   red col
6   11  1   red col
不幸的是,其结果并不是按照设定的颜色:
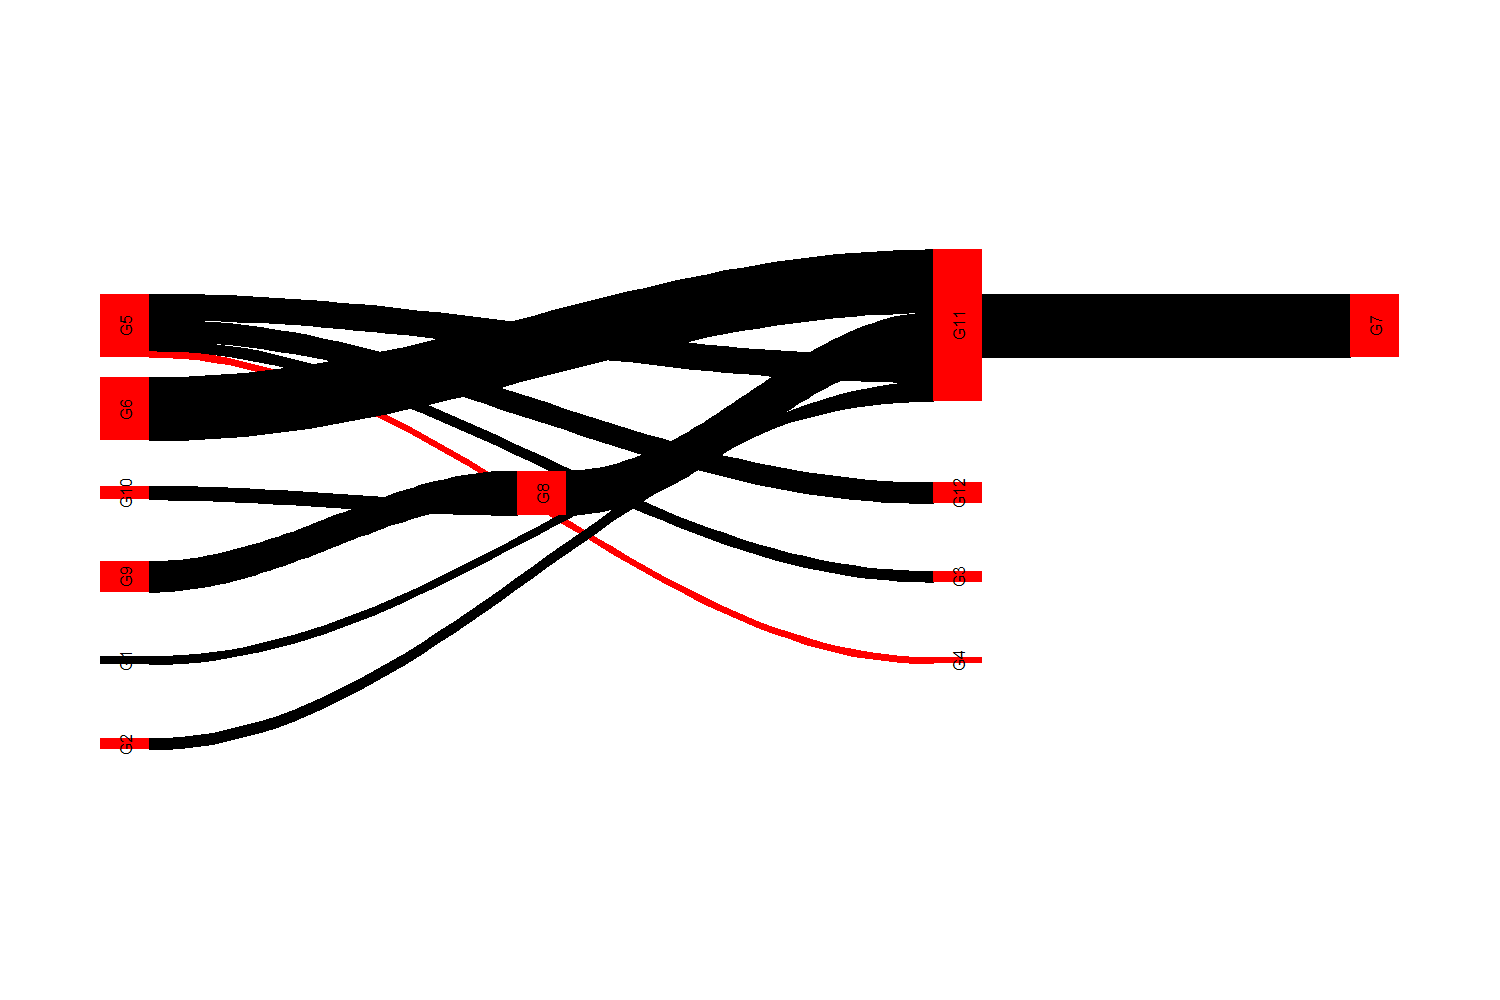
错误:
- 无绿色节点(ID=1)
- 边缘是黑色,而不是红色和黄色。
回答 1
Stack Overflow用户
发布于 2017-06-20 14:45:15
您必须确保包含颜色的列具有类型字符。标准read.csv使它们成为因子,也许可以使用stringsAsFactors=FALSE。
页面原文内容由Stack Overflow提供。腾讯云小微IT领域专用引擎提供翻译支持
原文链接:
https://stackoverflow.com/questions/38116479
复制相关文章
相似问题
腾讯云开发者

Copyright © 2013 - 2026 Tencent Cloud. All Rights Reserved. 腾讯云 版权所有
深圳市腾讯计算机系统有限公司 ICP备案/许可证号:粤B2-20090059 ![]() 粤公网安备44030502008569号
粤公网安备44030502008569号
腾讯云计算(北京)有限责任公司 京ICP证150476号 | 京ICP备11018762号