
如何在DiagrammeR R中增加节点间的距离
如何在DiagrammeR R中增加节点间的距离
提问于 2016-06-27 13:48:49
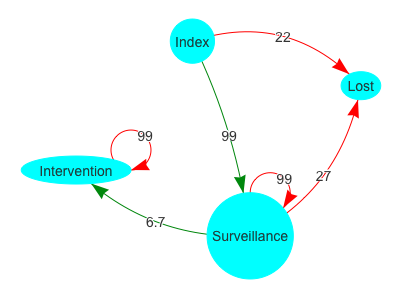
我在R演播室中有一个很好的DiagrammeR图,但是节点太聚集,无法收集。我到处都找遍了,但我找不到办法扩大他们之间的距离。能给我看一下吗?
这是我的代码:
library(magrittr)
library(DiagrammeR)

# Create a simple NDF
nodes <- create_nodes(nodes = c("Index", "Surveillance", "Intervention","Lost"),
                     label = TRUE,
                     fontsize=55,
                     type = "lower",
                     style = "filled",
                     color = "aqua",
                     shape = c("circle", "circle",
                               "rectangle", "rectangle"),
                     data = c(30.5, 2.6, 9.4, 2.7))

edges <- create_edges(from = c("Index", "Surveillance","Surveillance","Intervention", "Surveillance", "Index" ),
                  to = c("Surveillance", "Intervention","Surveillance","Intervention", "Lost", "Lost"),
                  rel = c(99, 6.7, 99, 99, 27, 22),
                  arrowhead = rep("normal", 6),
                  color = c("green", "green", "red", "red", "red", "red"))


graph <-
  create_graph(
    nodes_df = nodes,
    edges_df = edges,
    graph_attrs <-
      c("layout = dot","overlap = FALSE","outputorder = edgesfirst"),
    node_attrs <-
      c("shape = circle",
        "fixedsize = TRUE",
        "width = 100",
        "penwidth = 1",
        "color = DodgerBlue",
        "style = filled",
        "fillcolor = Aqua",
        "alpha_fillcolor = 0.5",
        "fontname = Helvetica",
        "fontcolor = Black"),
    edge_attrs = "color = gray20")

# View the graph
render_graph(graph,layout=constant,output="visNetwork")回答 1
Stack Overflow用户
回答已采纳
发布于 2016-06-27 14:03:50
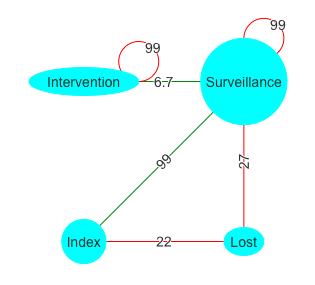
您只需为不同节点之间的箭头设置长度:
edges <- create_edges(from = c("Index", "Surveillance","Surveillance","Intervention", "Surveillance", "Index" ),
                      to = c("Surveillance", "Intervention","Surveillance","Intervention", "Lost", "Lost"),
                      rel = c(99, 6.7, 99, 99, 27, 22),
                      arrowhead = rep("normal", 6),
                      color = c("green", "green", "red", "red", "red", "red"),
                      length = c(200,200,50,50,200,200))
或者您可以为每个节点定义一个精确的点:
nodes <- create_nodes(nodes = c("Index", "Surveillance", "Intervention","Lost"),
                     label = TRUE,
                     fontsize = 55,
                     type = "lower",
                     style = "filled",
                     color = "aqua",
                     shape = c("circle", "circle",
                               "rectangle", "rectangle"),
                     data = c(30.5, 2.6, 9.4, 2.7),
                     x = c(-80,80,-80,80),
                     y = c(-80,80,80,-80))
页面原文内容由Stack Overflow提供。腾讯云小微IT领域专用引擎提供翻译支持
原文链接:
https://stackoverflow.com/questions/38055696
复制相关文章
相似问题
腾讯云开发者

Copyright © 2013 - 2026 Tencent Cloud. All Rights Reserved. 腾讯云 版权所有
深圳市腾讯计算机系统有限公司 ICP备案/许可证号:粤B2-20090059 ![]() 粤公网安备44030502008569号
粤公网安备44030502008569号
腾讯云计算(北京)有限责任公司 京ICP证150476号 | 京ICP备11018762号