
小波包:"cex.axis“不适用于plot.biwavelet();bug?
我使用biwavelet软件包进行小波分析。但是,当我想使用cex.axis调整轴的标签大小时,标签大小不会改变。另一方面,cex.lab和cex.main工作得很好。这是个虫子吗?下面给出一个可重复的例子。
library(biwavelet)
t1 <- cbind(1:100, rnorm(100))
t2 <- cbind(1:100, rnorm(100))
# Continuous wavelet transform
wt.t1 <- wt(t1)
par(oma = c(0, 0.5, 0, 0), mar = c(4, 2, 2, 4))
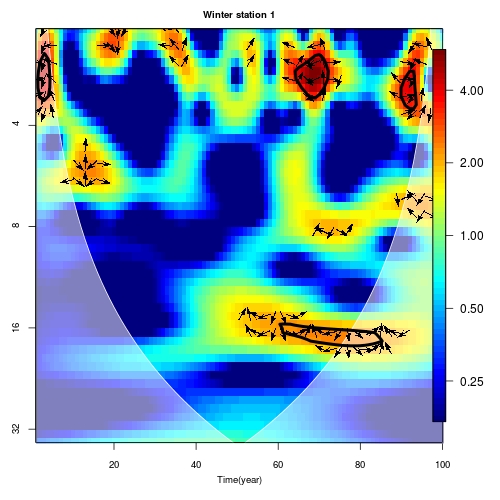
plot(wt.t1,plot.cb = T,plot.phase = T,type = 'power.norm',
xlab = 'Time(year)',ylab = 'Period(year)',mgp=c(2,1,0),
main='Winter station 1',cex.main=0.8,cex.lab=0.8,cex.axis=0.8)编辑
一个月前,这个网站上有一个问题:Wavelets plot: changing x-, y- axis, and color plot,但没有解决。这次有什么帮助吗?谢谢!
回答 2
Stack Overflow用户
发布于 2016-06-25 04:47:33
,是的,它是个bug。下面是修补版本: my.plot.biwavelet()
此版本接受参数cex.axis (默认为1),您可以在需要时对其进行更改。最后,我将在“解释”一节中向你们简要解释问题所在。
my.plot.biwavelet <- function (x, ncol = 64, fill.cols = NULL, xlab = "Time", ylab = "Period",
    tol = 1, plot.cb = FALSE, plot.phase = FALSE, type = "power.corr.norm",
    plot.coi = TRUE, lwd.coi = 1, col.coi = "white", lty.coi = 1,
    alpha.coi = 0.5, plot.sig = TRUE, lwd.sig = 4, col.sig = "black",
    lty.sig = 1, bw = FALSE, legend.loc = NULL, legend.horiz = FALSE,
    arrow.len = min(par()$pin[2]/30, par()$pin[1]/40), arrow.lwd = arrow.len *
        0.3, arrow.cutoff = 0.9, arrow.col = "black", xlim = NULL,
    ylim = NULL, zlim = NULL, xaxt = "s", yaxt = "s", form = "%Y", cex.axis = 1,
    ...)  {
         if (is.null(fill.cols)) {
             if (bw) {
                fill.cols <- c("black", "white")
            }
            else {
                fill.cols <- c("#00007F", "blue", "#007FFF",
                  "cyan", "#7FFF7F", "yellow", "#FF7F00", "red",
                  "#7F0000")
            }
        }
        col.pal <- colorRampPalette(fill.cols)
        fill.colors <- col.pal(ncol)
        types <- c("power.corr.norm", "power.corr", "power.norm",
            "power", "wavelet", "phase")
        type <- match.arg(tolower(type), types)
        if (type == "power.corr" | type == "power.corr.norm") {
            if (x$type == "wtc" | x$type == "xwt") {
                x$power <- x$power.corr
                x$wave <- x$wave.corr
            }
            else {
                x$power <- x$power.corr
            }
        }
         if (type == "power.norm" | type == "power.corr.norm") {
            if (x$type == "xwt") {
                zvals <- log2(x$power)/(x$d1.sigma * x$d2.sigma)
                if (is.null(zlim)) {
                   zlim <- range(c(-1, 1) * max(zvals))
                }
                zvals[zvals < zlim[1]] <- zlim[1]
                locs <- pretty(range(zlim), n = 5)
                leg.lab <- 2^locs
            }
            else if (x$type == "wtc" | x$type == "pwtc") {
                zvals <- x$rsq
                zvals[!is.finite(zvals)] <- NA
                if (is.null(zlim)) {
                  zlim <- range(zvals, na.rm = TRUE)
                }
                zvals[zvals < zlim[1]] <- zlim[1]
                locs <- pretty(range(zlim), n = 5)
                leg.lab <- locs
            }
            else {
                zvals <- log2(abs(x$power/x$sigma2))
                if (is.null(zlim)) {
                  zlim <- range(c(-1, 1) * max(zvals))
                }
                zvals[zvals < zlim[1]] <- zlim[1]
                locs <- pretty(range(zlim), n = 5)
                leg.lab <- 2^locs
            }
        }
        else if (type == "power" | type == "power.corr") {
            zvals <- log2(x$power)
            if (is.null(zlim)) {
                zlim <- range(c(-1, 1) * max(zvals))
            }
            zvals[zvals < zlim[1]] <- zlim[1]
            locs <- pretty(range(zlim), n = 5)
            leg.lab <- 2^locs
        }
        else if (type == "wavelet") {
            zvals <- (Re(x$wave))
            if (is.null(zlim)) {
                zlim <- range(zvals)
            }
            locs <- pretty(range(zlim), n = 5)
            leg.lab <- locs
        }
        else if (type == "phase") {
            zvals <- x$phase
            if (is.null(zlim)) {
                zlim <- c(-pi, pi)
            }
            locs <- pretty(range(zlim), n = 5)
            leg.lab <- locs
        }
        if (is.null(xlim)) {
            xlim <- range(x$t)
        }
        yvals <- log2(x$period)
        if (is.null(ylim)) {
            ylim <- range(yvals)
        }
        else {
             ylim <- log2(ylim)
        }
        image(x$t, yvals, t(zvals), zlim = zlim, xlim = xlim,
             ylim = rev(ylim), xlab = xlab, ylab = ylab, yaxt = "n",
             xaxt = "n", col = fill.colors, ...)
        box()
         if (class(x$xaxis)[1] == "Date" | class(x$xaxis)[1] ==
              "POSIXct") {
             if (xaxt != "n") {
                  xlocs <- pretty(x$t) + 1
                 axis(side = 1, at = xlocs, labels = format(x$xaxis[xlocs],
                   form))
             }
          }
         else {
              if (xaxt != "n") {
                xlocs <- axTicks(1)
                axis(side = 1, at = xlocs, cex.axis = cex.axis)
             }
        }
        if (yaxt != "n") {
            axis.locs <- axTicks(2)
            yticklab <- format(2^axis.locs, dig = 1)
            axis(2, at = axis.locs, labels = yticklab, cex.axis = cex.axis)
         }
         if (plot.coi) {
             polygon(x = c(x$t, rev(x$t)), lty = lty.coi, lwd = lwd.coi,
                  y = c(log2(x$coi), rep(max(log2(x$coi), na.rm = TRUE),
                  length(x$coi))), col = adjustcolor(col.coi,
                  alpha.f = alpha.coi), border = col.coi)
         }
         if (plot.sig & length(x$signif) > 1) {
             if (x$type %in% c("wt", "xwt")) {
                 contour(x$t, yvals, t(x$signif), level = tol,
                  col = col.sig, lwd = lwd.sig, add = TRUE, drawlabels = FALSE)
              }
             else {
                 tmp <- x$rsq/x$signif
                 contour(x$t, yvals, t(tmp), level = tol, col = col.sig,
                   lwd = lwd.sig, add = TRUE, drawlabels = FALSE)
             }
         }
         if (plot.phase) {
             a <- x$phase
             locs.phases <- which(zvals < quantile(zvals, arrow.cutoff))
             a[locs.phases] <- NA
              phase.plot(x$t, log2(x$period), a, arrow.len = arrow.len,
                 arrow.lwd = arrow.lwd, arrow.col = arrow.col)
         }
          box()
          if (plot.cb) {
              fields::image.plot(x$t, yvals, t(zvals), zlim = zlim, ylim = rev(range(yvals)),
                  xlab = xlab, ylab = ylab, col = fill.colors,
                 smallplot = legend.loc, horizontal = legend.horiz,
                legend.only = TRUE, axis.args = list(at = locs,
                    labels = format(leg.lab, dig = 2)), xpd = NA)
        }
    }
测试
library(biwavelet)
t1 <- cbind(1:100, rnorm(100))
t2 <- cbind(1:100, rnorm(100))
# Continuous wavelet transform
wt.t1 <- wt(t1)
par(oma = c(0, 0.5, 0, 0), mar = c(4, 2, 2, 4))
my.plot.biwavelet(wt.t1,plot.cb = T,plot.phase = T,type = 'power.norm',
   xlab = 'Time(year)',ylab = 'Period(year)',mgp=c(2,1,0),
   main='Winter station 1',cex.main=0.8,cex.lab=0.8,cex.axis=0.8)
正如预期的那样,它正在发挥作用。
解释
在plot.biwavelet()中,为什么通过...传递cex.axis不起作用?
plot.biwavelet()主要分三个阶段生成最终的情节:
image(..., xaxt = "n", yaxt = "n"),用于生成基本图;- 添加轴的
axis(1, at = atTicks(1)); axis(2, at = atTicks(2)); - 用于显示彩色图例条的
fields::image.plot()。
现在,虽然这个函数接受...,但是它们只被输入到第一个image()调用,而下面的axis() (包括polygon(), contour()__、phase.plot()__)和image.plot()没有从...获取任何信息。稍后调用axis()时,不支持有关轴控制的灵活规范。
我猜在包开发期间,遇到了如下所描述的问题:Giving arguments from “…” argument to right function in R。也许作者没有意识到这个潜在的问题,留下了一个漏洞。我对那篇文章的回答,以及罗兰的评论,都指向了一个强有力的解决方案。
我不是包作者,所以无法决定他将如何解决这个问题。我的修复方法很残酷,但适用于您的临时需要:只需将cex.axis参数添加到axis()调用即可。我已经与Tarik (包作者)通过电子邮件,我相信他会给你一个更好的解释和解决方案。
Stack Overflow用户
发布于 2016-06-25 18:56:58
我通过将...参数传递给plot.biwavelet中的axis来解决这个问题。您的代码现在应该按照需要工作。注意,对cex.axis和其他axis参数的更改将影响所有三个轴(x、y、z)。
您可以通过在biwavelet控制台上发出以下命令(假设您已经安装了包devtools )从GitHub下载新版本(0.20.8):devtools::install_github("tgouhier/biwavelet")
谢谢你指出错误!
https://stackoverflow.com/questions/38024574
复制相似问题
腾讯云开发者

Copyright © 2013 - 2026 Tencent Cloud. All Rights Reserved. 腾讯云 版权所有
深圳市腾讯计算机系统有限公司 ICP备案/许可证号:粤B2-20090059 ![]() 粤公网安备44030502008569号
粤公网安备44030502008569号
腾讯云计算(北京)有限责任公司 京ICP证150476号 | 京ICP备11018762号