
从csv文件中检索所有行并绘制
从csv文件中检索所有行并绘制
提问于 2016-06-22 15:45:51
我需要从函数生成的csv文件中检索行:
def your_func(row):
    return (row['x-momentum']**2+ row['y-momentum']**2 + row['z-momentum']**2)**0.5 / row['mass']

columns_to_keep = ['#time', 'x-momentum', 'y-momentum', 'z-momentum', 'mass']
dataframe = pd.read_csv("./flash.csv", usecols=columns_to_keep)
dataframe['mean_velocity'] = dataframe.apply(your_func, axis=1)

print dataframe
我一直排到29s,然后跳到最后几行,我还需要把这个列2对1画成图。
回答 1
Stack Overflow用户
回答已采纳
发布于 2016-06-22 17:32:30
您可以调整pd.options.display.max_rows选项,但它不会影响您的绘图,因此您的绘图将包含您的所有数据
演示:
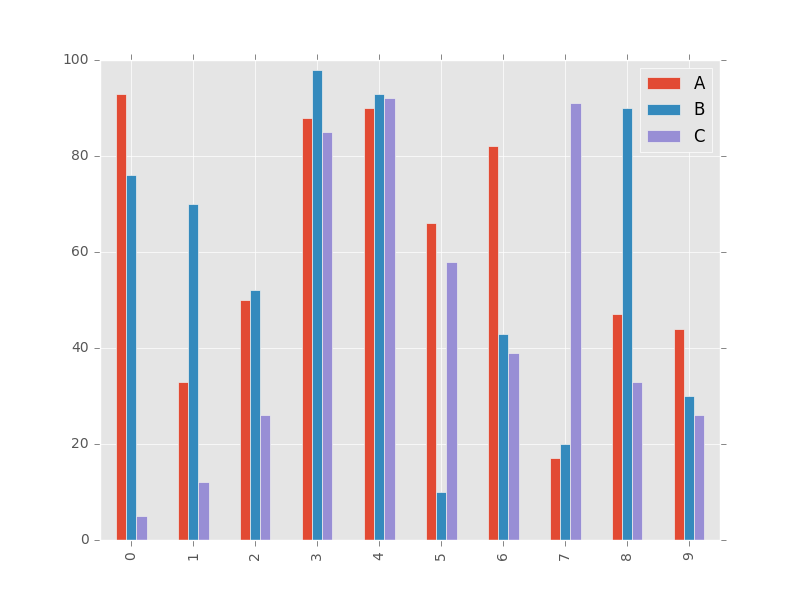
In [25]: df = pd.DataFrame(np.random.randint(0,100,size=(10, 3)), columns=list('ABC'))

In [26]: df
Out[26]:
    A   B   C
0  93  76   5
1  33  70  12
2  50  52  26
3  88  98  85
4  90  93  92
5  66  10  58
6  82  43  39
7  17  20  91
8  47  90  33
9  44  30  26

In [27]: pd.options.display.max_rows = 4
现在它最多显示4行
In [36]: df
Out[36]:
     A   B   C
0   93  76   5
1   33  70  12
..  ..  ..  ..
8   47  90  33
9   44  30  26

[10 rows x 3 columns]
但它会画出你所有的数据
In [37]: df.plot.bar()
Out[37]: <matplotlib.axes._subplots.AxesSubplot at 0x49e2d68>
In [38]: pd.options.display.max_rows = 60

In [39]: df
Out[39]:
    A   B   C
0  93  76   5
1  33  70  12
2  50  52  26
3  88  98  85
4  90  93  92
5  66  10  58
6  82  43  39
7  17  20  91
8  47  90  33
9 44 30 26页面原文内容由Stack Overflow提供。腾讯云小微IT领域专用引擎提供翻译支持
原文链接:
https://stackoverflow.com/questions/37972785
复制相关文章
相似问题
腾讯云开发者

Copyright © 2013 - 2026 Tencent Cloud. All Rights Reserved. 腾讯云 版权所有
深圳市腾讯计算机系统有限公司 ICP备案/许可证号:粤B2-20090059 ![]() 粤公网安备44030502008569号
粤公网安备44030502008569号
腾讯云计算(北京)有限责任公司 京ICP证150476号 | 京ICP备11018762号