
R中自定义标记的传单图例
R中自定义标记的传单图例
提问于 2016-06-16 14:43:50
我有一个R闪亮的应用程序,使用传单创建一个交互式地图。在此地图上,一个分类变量用于指定不同类型的点,并使用自定义标记(取决于因素级别的不同图标)可视化。
我想做的是添加一个图例到情节,但让图例显示各种标志图标,而不是坚实的颜色。传奇教程没有涵盖这一点。
我遇到了另一个所以回答这似乎解决了这个问题 --但是它是用JavaScript完成的,我不知道如何翻译它/如果它可以被翻译成在R中工作,有谁知道如何做到这一点呢?
一个可复制的基本例子:
library(leaflet)

# Sample Data
data(quakes)
quakes <- quakes[1:10,]

# Choose Icon:
leafIcons <- icons(
  iconUrl = ifelse(quakes$mag < 4.6,
                   "http://leafletjs.com/docs/images/leaf-green.png",
                   "http://leafletjs.com/docs/images/leaf-red.png"
  ),
  iconWidth = 38, iconHeight = 95,
  iconAnchorX = 22, iconAnchorY = 94)

# Produce Map:
leaflet(data = quakes) %>% addTiles() %>%
addMarkers(~long, ~lat, icon = leafIcons)回答 2
Stack Overflow用户
回答已采纳
发布于 2016-06-16 14:56:11
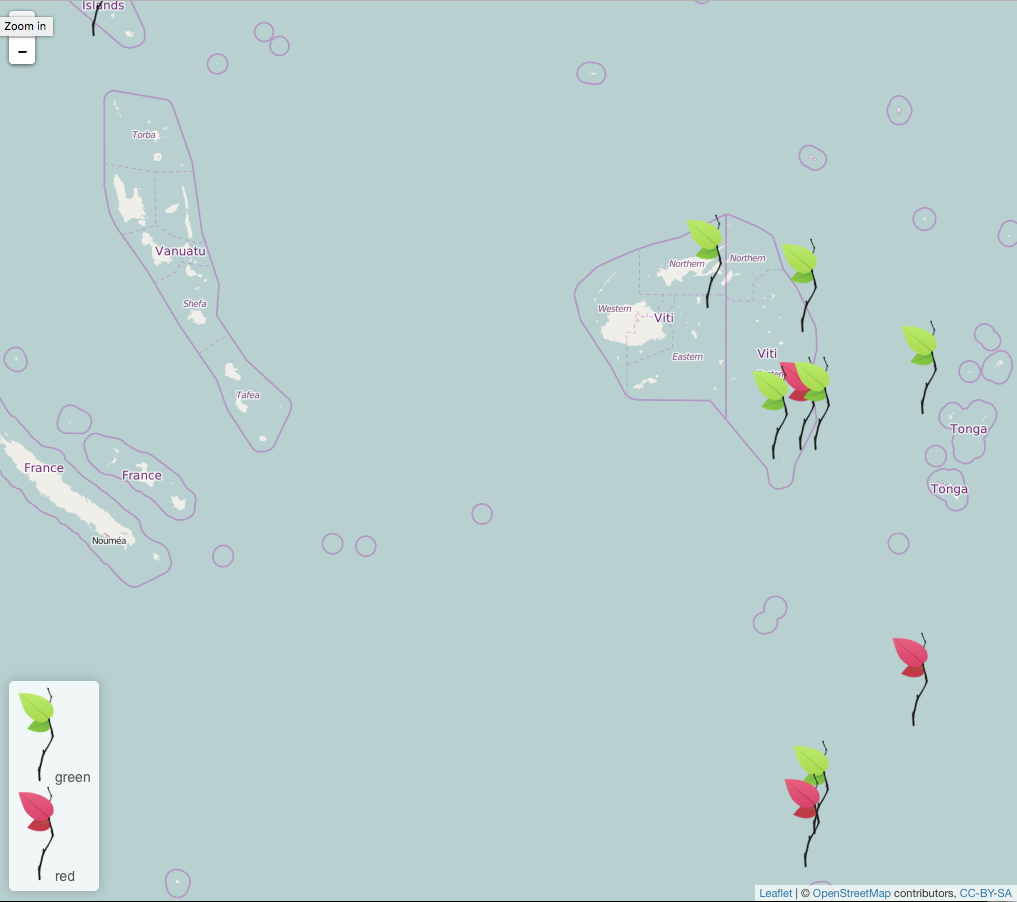
虽然图标的使用是目前未执行中的addLegend(),但是益辉建议使用addControl(),使用原始的html --这是非常完美的!
library(leaflet)

# Sample Data
data(quakes)
quakes <- quakes[1:10,]

# Choose Icon:
leafIcons <- icons(
  iconUrl = ifelse(quakes$mag < 4.6,
                   "http://leafletjs.com/examples/custom-icons/leaf-green.png",
                   "http://leafletjs.com/examples/custom-icons/leaf-red.png"
  ),
  iconWidth = 38, iconHeight = 95,
  iconAnchorX = 22, iconAnchorY = 94)

html_legend <- "<img src='http://leafletjs.com/examples/custom-icons/leaf-green.png'>green<br/>
<img src='http://leafletjs.com/examples/custom-icons/leaf-red.png'>red"

# Produce Map:
leaflet(data = quakes) %>% addTiles() %>%
  addMarkers(~long, ~lat, icon = leafIcons) %>%
  addControl(html = html_legend, position = "bottomleft")
链接
- 绿色:http://leafletjs.com/examples/custom-icons/leaf-green.png
- 红色:http://leafletjs.com/examples/custom-icons/leaf-red.png
- 橙色:http://leafletjs.com/examples/custom-icons/leaf-orange.png
它产生:
Stack Overflow用户
发布于 2016-08-25 10:35:55
响应上面的注释:您可以更改图例中图标的大小,而不管您定义的初始大小如何。你要做的就是添加
style='width:(desired_width)px;height:(desired_height)px';到HTML部分。
具体来说,您的代码希望:
library(leaflet)

# Sample Data
data(quakes)
quakes <- quakes[1:10,]

# Choose Icon:
leafIcons <- icons(
iconUrl = ifelse(quakes$mag < 4.6,
               "http://leafletjs.com/docs/images/leaf-green.png",
               "http://leafletjs.com/docs/images/leaf-red.png"
  ),
  iconWidth = 38, iconHeight = 95,
  iconAnchorX = 22, iconAnchorY = 94)

html_legend <- "<img src='http://leafletjs.com/docs/images/leaf-green.png'
style='width:10px;height:10px;'>green<br/>

<img src='http://leafletjs.com/docs/images/leaf-red.png'
style='width:10px;height:10px;'>red"

# Produce Map:
leaflet(data = quakes) %>% addTiles() %>%
addMarkers(~long, ~lat, icon = leafIcons) %>%
addControl(html = html_legend, position = "bottomleft")页面原文内容由Stack Overflow提供。腾讯云小微IT领域专用引擎提供翻译支持
原文链接:
https://stackoverflow.com/questions/37862467
复制相关文章
相似问题
腾讯云开发者

Copyright © 2013 - 2026 Tencent Cloud. All Rights Reserved. 腾讯云 版权所有
深圳市腾讯计算机系统有限公司 ICP备案/许可证号:粤B2-20090059 ![]() 粤公网安备44030502008569号
粤公网安备44030502008569号
腾讯云计算(北京)有限责任公司 京ICP证150476号 | 京ICP备11018762号