
rCharts sankey图中的单元
我使用以下代码生成rCharts Sankey图(桑基):
if(!require(rCharts)){
  library(devtools)
  install_github('ramnathv/rCharts')
}
library(rCharts)

sankeyPlot <- rCharts$new()
sankeyPlot$setLib('http://timelyportfolio.github.io/rCharts_d3_sankey')
sankeyPlot$set(
  data = data.frame(source=c('Cold','Warm','Total'),target=c('Total','Total','End'),value=c(20,80,100)),
  nodeWidth = 15,
  nodePadding = 10,
  layout = 32,
  width = 500,
  height = 300,
  units = "TWh",
  labelFormat = ".1%"
)
sankeyPlot$setTemplate(
  afterScript = "
  <script>
  // to be specific in case you have more than one chart
  d3.selectAll('#{{ chartId }} svg path.link')
  .style('stroke', function(d){
  //here we will use the source color
  //if you want target then sub target for source
  //or if you want something other than gray
  //supply a constant
  //or use a categorical scale or gradient
  return d.source.color;
  })
  //note no changes were made to opacity
  //to do uncomment below but will affect mouseover
  //so will need to define mouseover and mouseout
  //happy to show how to do this also
  // .style('stroke-opacity', .7)
  </script>
  ")
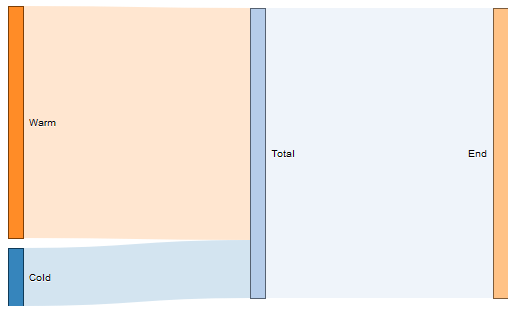
sankeyPlot在Sankeyplot$set中,我为单元设置了一个值。然而,我既没有看到单位,也没有看到价值。单元示例来自官方的github文档(example_hirst_f1.R)。如何显示图表中的值和单位?
回答 2
Stack Overflow用户
发布于 2016-06-15 21:15:20
JeroenDM的答案也可以插入后面的脚本中。在这种情况下,无需修改就可以使用Github存储库。
sankeyPlot$setTemplate(
afterScript = "
<script>
// to be specific in case you have more than one chart
d3.selectAll('#{{ chartId }} svg path.link')
.style('stroke', function(d){
//here we will use the source color
//if you want target then sub target for source
//or if you want something other than gray
//supply a constant
//or use a categorical scale or gradient
return d.source.color;
})
//note no changes were made to opacity
//to do uncomment below but will affect mouseover
//so will need to define mouseover and mouseout
//happy to show how to do this also
// .style('stroke-opacity', .7)
units = ' TWh'
var formatNumber = d3.format('0,.0f'), // zero decimal places
format = function(d) { return formatNumber(d) + units; }
d3.selectAll('#{{ chartId }} svg .node text')
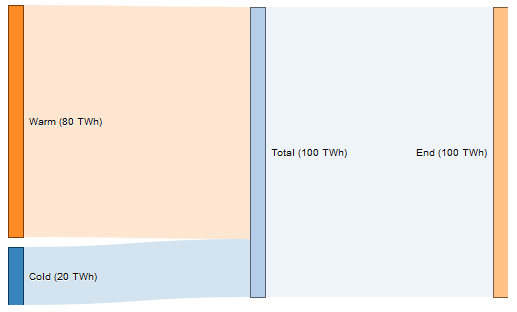
.text(function (d) { return d.name + ' (' + format(d.value) + ')'; })
</script>
")
Stack Overflow用户
发布于 2016-06-15 18:00:51
在sankeyPlot输出中,使用class=“节点”创建一个svg元素。在这个元素中,值及其单元被添加到代表节点的rect元素中的 title element 中。此title元素不是可见的元素。另一方面,名称被添加到文本元素中(在本例中是“温暖的”),并且是可见的。
您可以通过右键单击Rstudio中的“视图”窗口,然后“检查”来查看此结构。
Web检查器中节点结构的截图
快速修复方法是将值及其单位添加到此文本元素中。通过将布局/charts.html中的第105行替换为
.text(function (d) { return d.name; })使用
.text(function (d) { return d.name + " " + format(d.value); })然后用这个作为模板。
当然,可能有更好的解决办法。我认为title元素的存在是出于某种原因(可能在mouseover事件中使用它)。但至少这是个开始。希望能帮上忙。
https://stackoverflow.com/questions/37839387
复制相似问题
腾讯云开发者

Copyright © 2013 - 2026 Tencent Cloud. All Rights Reserved. 腾讯云 版权所有
深圳市腾讯计算机系统有限公司 ICP备案/许可证号:粤B2-20090059 ![]() 粤公网安备44030502008569号
粤公网安备44030502008569号
腾讯云计算(北京)有限责任公司 京ICP证150476号 | 京ICP备11018762号