
熊猫地块的变色条
熊猫地块的变色条
提问于 2016-06-01 07:19:47
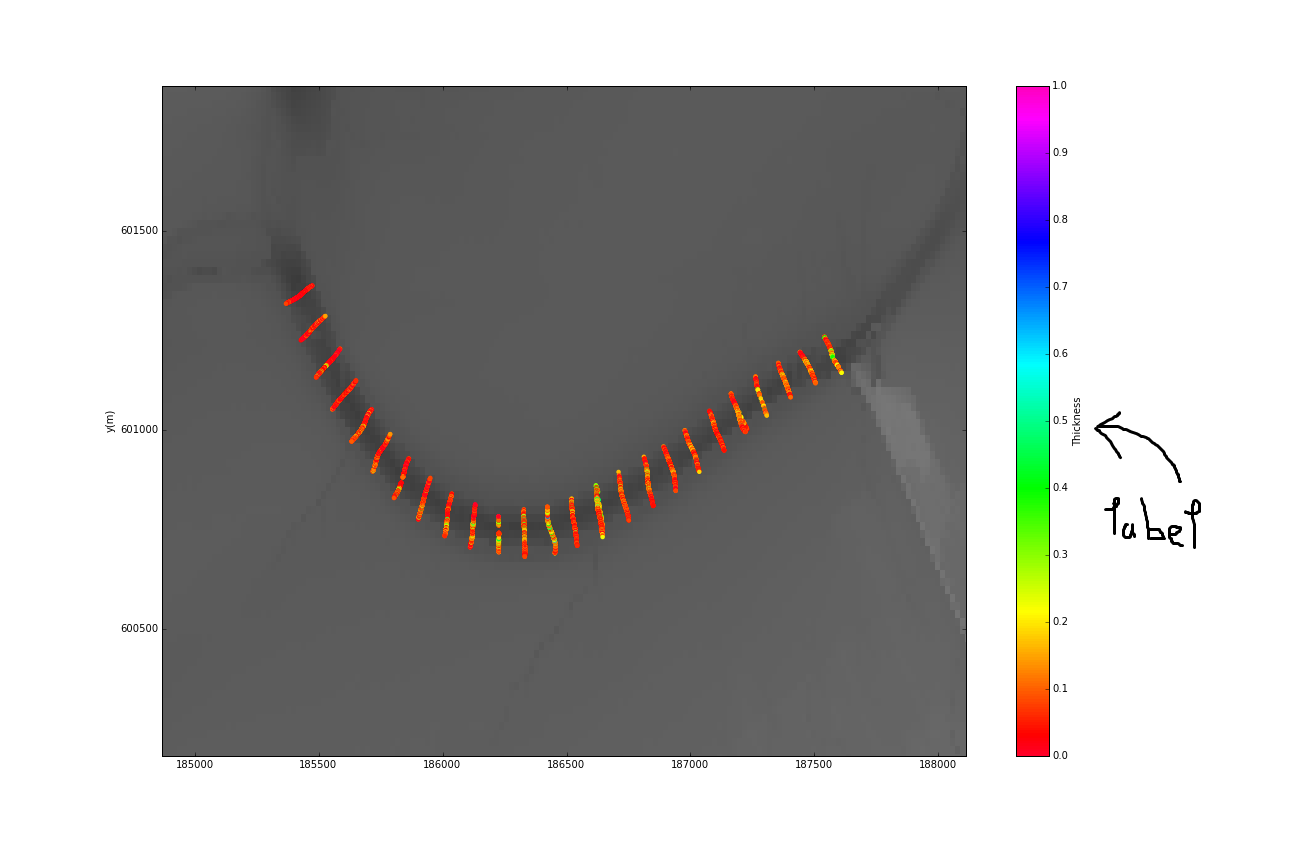
我用dataframe plot方法绘制了一个图表:
ax = df1.plot(x='Lat', y='Lon', kind='scatter', c='Thickness')结果是一个散点图,其中点被缩放到c='Thickness'中的参数集。图形旁边的彩色条自动接收标签Thickness。我想换一下。
我知道颜色条方法set_label,但我不知道如何从熊猫的plot函数返回的ax中访问彩色条对象。
如何访问绘图中的彩色条对象以更改其标签?
为了澄清,我添加了图表的图片。我对改变颜色条的标签很感兴趣。
回答 1
Stack Overflow用户
回答已采纳
发布于 2017-11-02 11:31:39
使用pandas设置colorbar的标签太复杂了。您可以直接使用matplotlib.pyplot,这是一个例子。
import numpy as np
import matplotlib.pyplot as plt

np.random.seed(0)
n = 100000
x = np.random.standard_normal(n)
y = 2.0 + 3.0 * x + 4.0 * np.random.standard_normal(n)
xmin = x.min()
xmax = x.max()
ymin = y.min()
ymax = y.max()

fig, axs = plt.subplots(ncols=2, sharey=True, figsize=(7, 4))
fig.subplots_adjust(hspace=0.5, left=0.07, right=0.93)
ax = axs[0]
hb = ax.hexbin(x, y, gridsize=50, cmap='inferno')
ax.axis([xmin, xmax, ymin, ymax])
ax.set_title("Hexagon binning")
cb = fig.colorbar(hb, ax=ax)
cb.set_label('counts')

ax = axs[1]
hb = ax.hexbin(x, y, gridsize=50, bins='log', cmap='inferno')
ax.axis([xmin, xmax, ymin, ymax])
ax.set_title("With a log color scale")
cb = fig.colorbar(hb, ax=ax)
cb.set_label('log10(N)')

plt.show()页面原文内容由Stack Overflow提供。腾讯云小微IT领域专用引擎提供翻译支持
原文链接:
https://stackoverflow.com/questions/37561953
复制相关文章
相似问题
腾讯云开发者

Copyright © 2013 - 2026 Tencent Cloud. All Rights Reserved. 腾讯云 版权所有
深圳市腾讯计算机系统有限公司 ICP备案/许可证号:粤B2-20090059  粤公网安备44030502008569号
腾讯云计算(北京)有限责任公司 京ICP证150476号 | 京ICP备11018762号