
rasterGrobs在gtable信元中的绝对定位
rasterGrobs在gtable信元中的绝对定位
提问于 2016-05-26 02:11:05
我一直试图在gtable单元格中指定rasterGrobs的绝对位置,但没有成功。我希望图像的范围能够与y轴上的值对齐。该脚本将钻芯图像与ggplot2方面绘制的多传感器数据对齐。例如,一个特殊的X射线核心图像需要它的顶部在192毫米,底部在1482毫米,但我希望刻度从0到1523毫米。请参阅所包含的链接,作为我正在做的一个例子,但为了简单,我只在这里张贴了一个MWE。是否可以在gtable单元格中指定rasterGrob的绝对位置?
就下面的MWE而言,到目前为止,我唯一的解决方案是使用使用Rlogo.png时设置的相对位置来移动rasterGrob()。使用"native"坐标似乎也不是我所需要的。类似地,我无法理解在gtable_add_grob()中调用的位置参数。
library(png)
library(ggplot2)
library(gtable)
# read Image
img <- readPNG(system.file("img", "Rlogo.png", package = "png"))
# convert to rastergrob
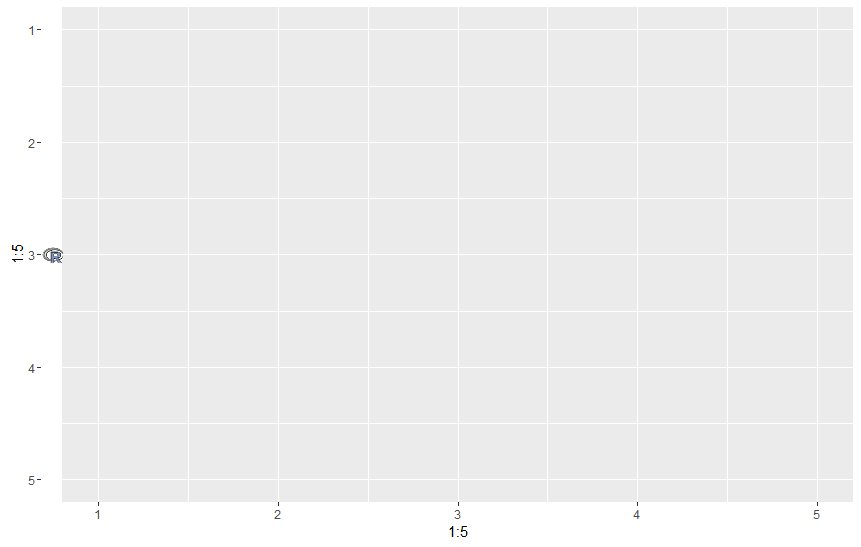
g <- rasterGrob(img, y = unit(0.5, "npc"), x = unit(0.5, "npc"))
# create plot
tp <- qplot(1:5, 1:5, geom="blank") + scale_y_reverse()
# convert plot to gtable
tt <- ggplot_gtable(ggplot_build(tp))
# add column to gtable to hold image
tt <- gtable_add_cols(tt, tt$width[[.5*4]], 3)
# add grob to cell 3, 4
tt <- gtable_add_grob(tt,g,3,4)
# render
grid.draw(tt)
在想出使用rasterGrob将图片添加到ggplot中的面板的解决方案之前,做了大量的搜索。也许有人可以提出一个更优雅的解决方案?
回答 1
Stack Overflow用户
回答已采纳
发布于 2016-05-26 02:41:49
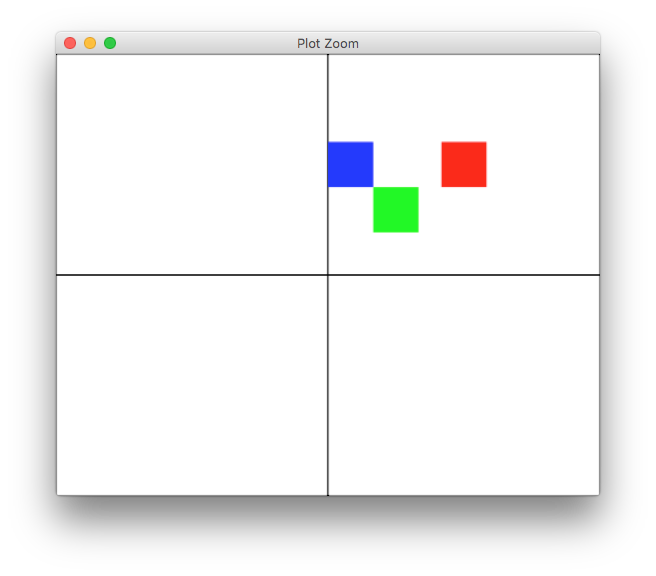
grob可以在单元格中设置其位置,如下所示
library(gridExtra)
library(grid)
library(gtable)

# quick shortcut to create a 2x2 gtable filled with 4 rectGrobs
tg <- arrangeGrob(grobs=replicate(4, rectGrob(), FALSE))

# red rect of fixed size with default position (0.5, 0.5) npc
rg1 <- rasterGrob("red", width=unit(1,"cm"), height=unit(1,"cm"))
# blue rect with specific x position (0) npc, left-justified
rg2 <- rasterGrob("blue", width=unit(1,"cm"), height=unit(1,"cm"),
                  x = 0, hjust=0)
# green rect at x = 1cm left-justified, y=-0.5cm from middle, top-justified
rg3 <- rasterGrob("green", width=unit(1,"cm"), height=unit(1,"cm"),
                  x = unit(1,"cm"), y=unit(0.5, "npc") - unit(0.5, "cm"),
                  hjust=0, vjust=1)

# place those on top
tg <- gtable_add_grob(tg, rg1, 1, 2, z = Inf, name = "default")
tg <- gtable_add_grob(tg, rg2, 1, 2, z = Inf, name = "left")
tg <- gtable_add_grob(tg, rg3, 1, 2, z = Inf, name = "custom")
grid.newpage()
grid.draw(tg)
页面原文内容由Stack Overflow提供。腾讯云小微IT领域专用引擎提供翻译支持
原文链接:
https://stackoverflow.com/questions/37450430
复制相关文章
相似问题
腾讯云开发者

Copyright © 2013 - 2026 Tencent Cloud. All Rights Reserved. 腾讯云 版权所有
深圳市腾讯计算机系统有限公司 ICP备案/许可证号:粤B2-20090059 ![]() 粤公网安备44030502008569号
粤公网安备44030502008569号
腾讯云计算(北京)有限责任公司 京ICP证150476号 | 京ICP备11018762号