
如何在不改变情节的情况下更改matplotlib中的图形画布大小?
如何在不改变情节的情况下更改matplotlib中的图形画布大小?
提问于 2016-05-25 20:25:07
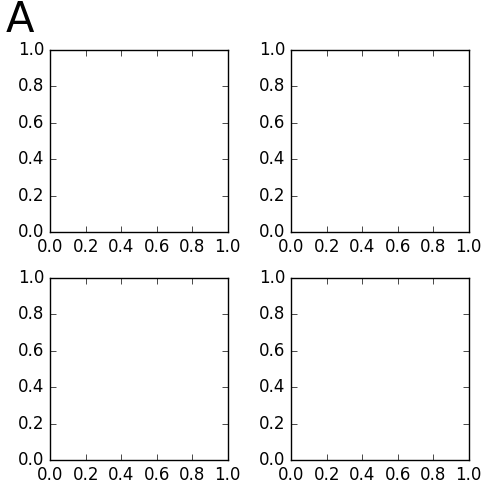
我想用面板标签("A“、"B”、“.”)来标注图形的面板。例如,我想在图形的左上角标注一组大的"A“,如下面的代码。如何更改图形画布以使这个"A”可见?
f = plt.figure(figsize=(5,5))
plt.subplot(2, 2, 1)
# this "A" is clipped in the plot
plt.annotate("A",
             xy = (-0.25, 1.1),
             xytext = (-0.25, 1.1),
             xycoords = 'axes fraction',
             textcoords = 'axes fraction',
             fontsize=30)
plt.subplot(2, 2, 2)
plt.subplot(2, 2, 3)
plt.subplot(2, 2, 4)
plt.tight_layout()
plt.show()
有没有一种方法可以在子图的左边添加“填充”,这样就可以将它们推到图形的右边,而不更改figsize参数?而不重新划分地块?画布上有足够的空间来贴合标签和副情节。
回答 1
Stack Overflow用户
回答已采纳
发布于 2016-05-27 08:15:01
添加plt.subplots_adjust()
f = plt.figure(figsize=(5,5))
plt.subplot(2, 2, 1)
# this "A" is clipped in the plot
plt.annotate("A",
             xy = (-0.25, 1.1),
             xytext = (-0.25, 1.1),
             xycoords = 'axes fraction',
             textcoords = 'axes fraction',
             fontsize=30)
plt.subplot(2, 2, 2)
plt.subplot(2, 2, 3)
plt.subplot(2, 2, 4)
plt.tight_layout()
plt.subplots_adjust(top=0.9)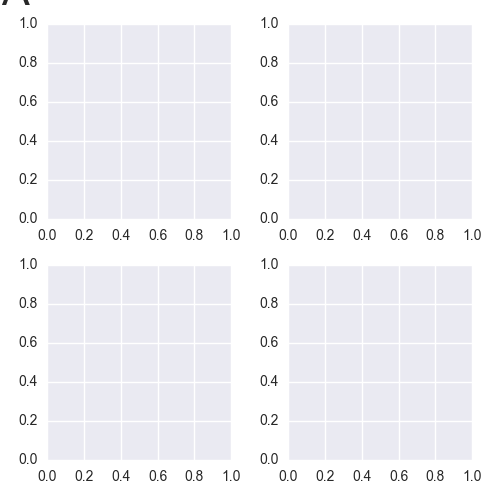
plt.show()只需确保不要将plt.tight_layout放在plt.subplots_adjust之后,因为这将覆盖更改。
还请参阅调整子图的这页面。
使用上述代码生成的数字如下所示:
页面原文内容由Stack Overflow提供。腾讯云小微IT领域专用引擎提供翻译支持
原文链接:
https://stackoverflow.com/questions/37446970
复制相关文章
相似问题
腾讯云开发者

Copyright © 2013 - 2026 Tencent Cloud. All Rights Reserved. 腾讯云 版权所有
深圳市腾讯计算机系统有限公司 ICP备案/许可证号:粤B2-20090059 ![]() 粤公网安备44030502008569号
粤公网安备44030502008569号
腾讯云计算(北京)有限责任公司 京ICP证150476号 | 京ICP备11018762号