
提克兹图片:放大地块的另一面。
提克兹图片:放大地块的另一面。
提问于 2016-05-24 16:03:52
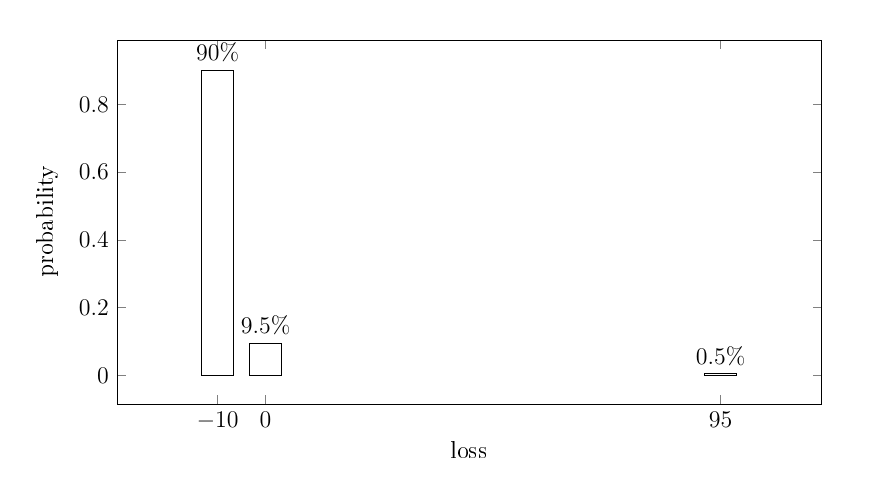
我想在我的条形图中把一些文字标签放在我的条形图上。为了给他们腾出空间,我尝试使用enlarge limits,但它似乎改变了我的整个情节,切断了底部。我怎么能解决这个问题?
我附加了代码、原始情节和行enlarge y limits未注释的代码。
\begin{tikzpicture}
\begin{axis}[
    xlabel = {loss},
    ylabel = {probability},
    enlarge x limits=0.2,
    %enlarge y limits={rel=0.2,upper},
    bar width = 16pt,
    width=14cm,
    height=8cm,
    xtick=data]
    \addplot[ybar,fill=white] coordinates {(-10,0.9) (0,0.095) (95,0.005)};
    \node[above] at (axis cs:-10,0.9) {$90\%$};
    \node[above] at (axis cs:0,0.095) {$9.5\%$};
    \node[above] at (axis cs:95,0.005) {$0.5\%$};
\end{axis}
\end{tikzpicture}
\end{figure}
回答 1
Stack Overflow用户
回答已采纳
发布于 2016-05-24 16:40:39
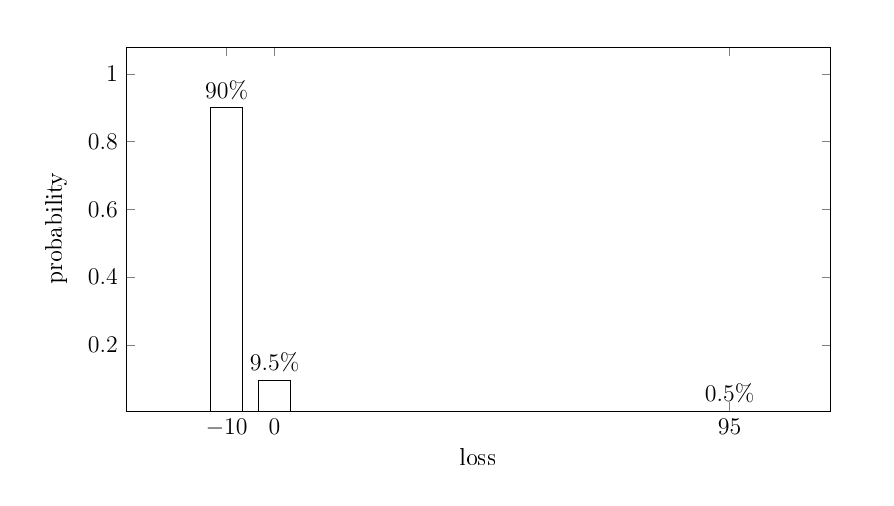
好的,我刚刚发现我可以用ymax:ymax=1.1达到想要的效果
页面原文内容由Stack Overflow提供。腾讯云小微IT领域专用引擎提供翻译支持
原文链接:
https://stackoverflow.com/questions/37418637
复制相关文章
相似问题
腾讯云开发者

Copyright © 2013 - 2026 Tencent Cloud. All Rights Reserved. 腾讯云 版权所有
深圳市腾讯计算机系统有限公司 ICP备案/许可证号:粤B2-20090059 ![]() 粤公网安备44030502008569号
粤公网安备44030502008569号
腾讯云计算(北京)有限责任公司 京ICP证150476号 | 京ICP备11018762号