
ggplot2:如何获得回归线方程r^2和p值的值?
ggplot2:如何获得回归线方程r^2和p值的值?
提问于 2016-05-21 16:57:14
用geom_smooth函数绘出的线性回归方程,r^2和p值是无法求出的。
这是我的密码:
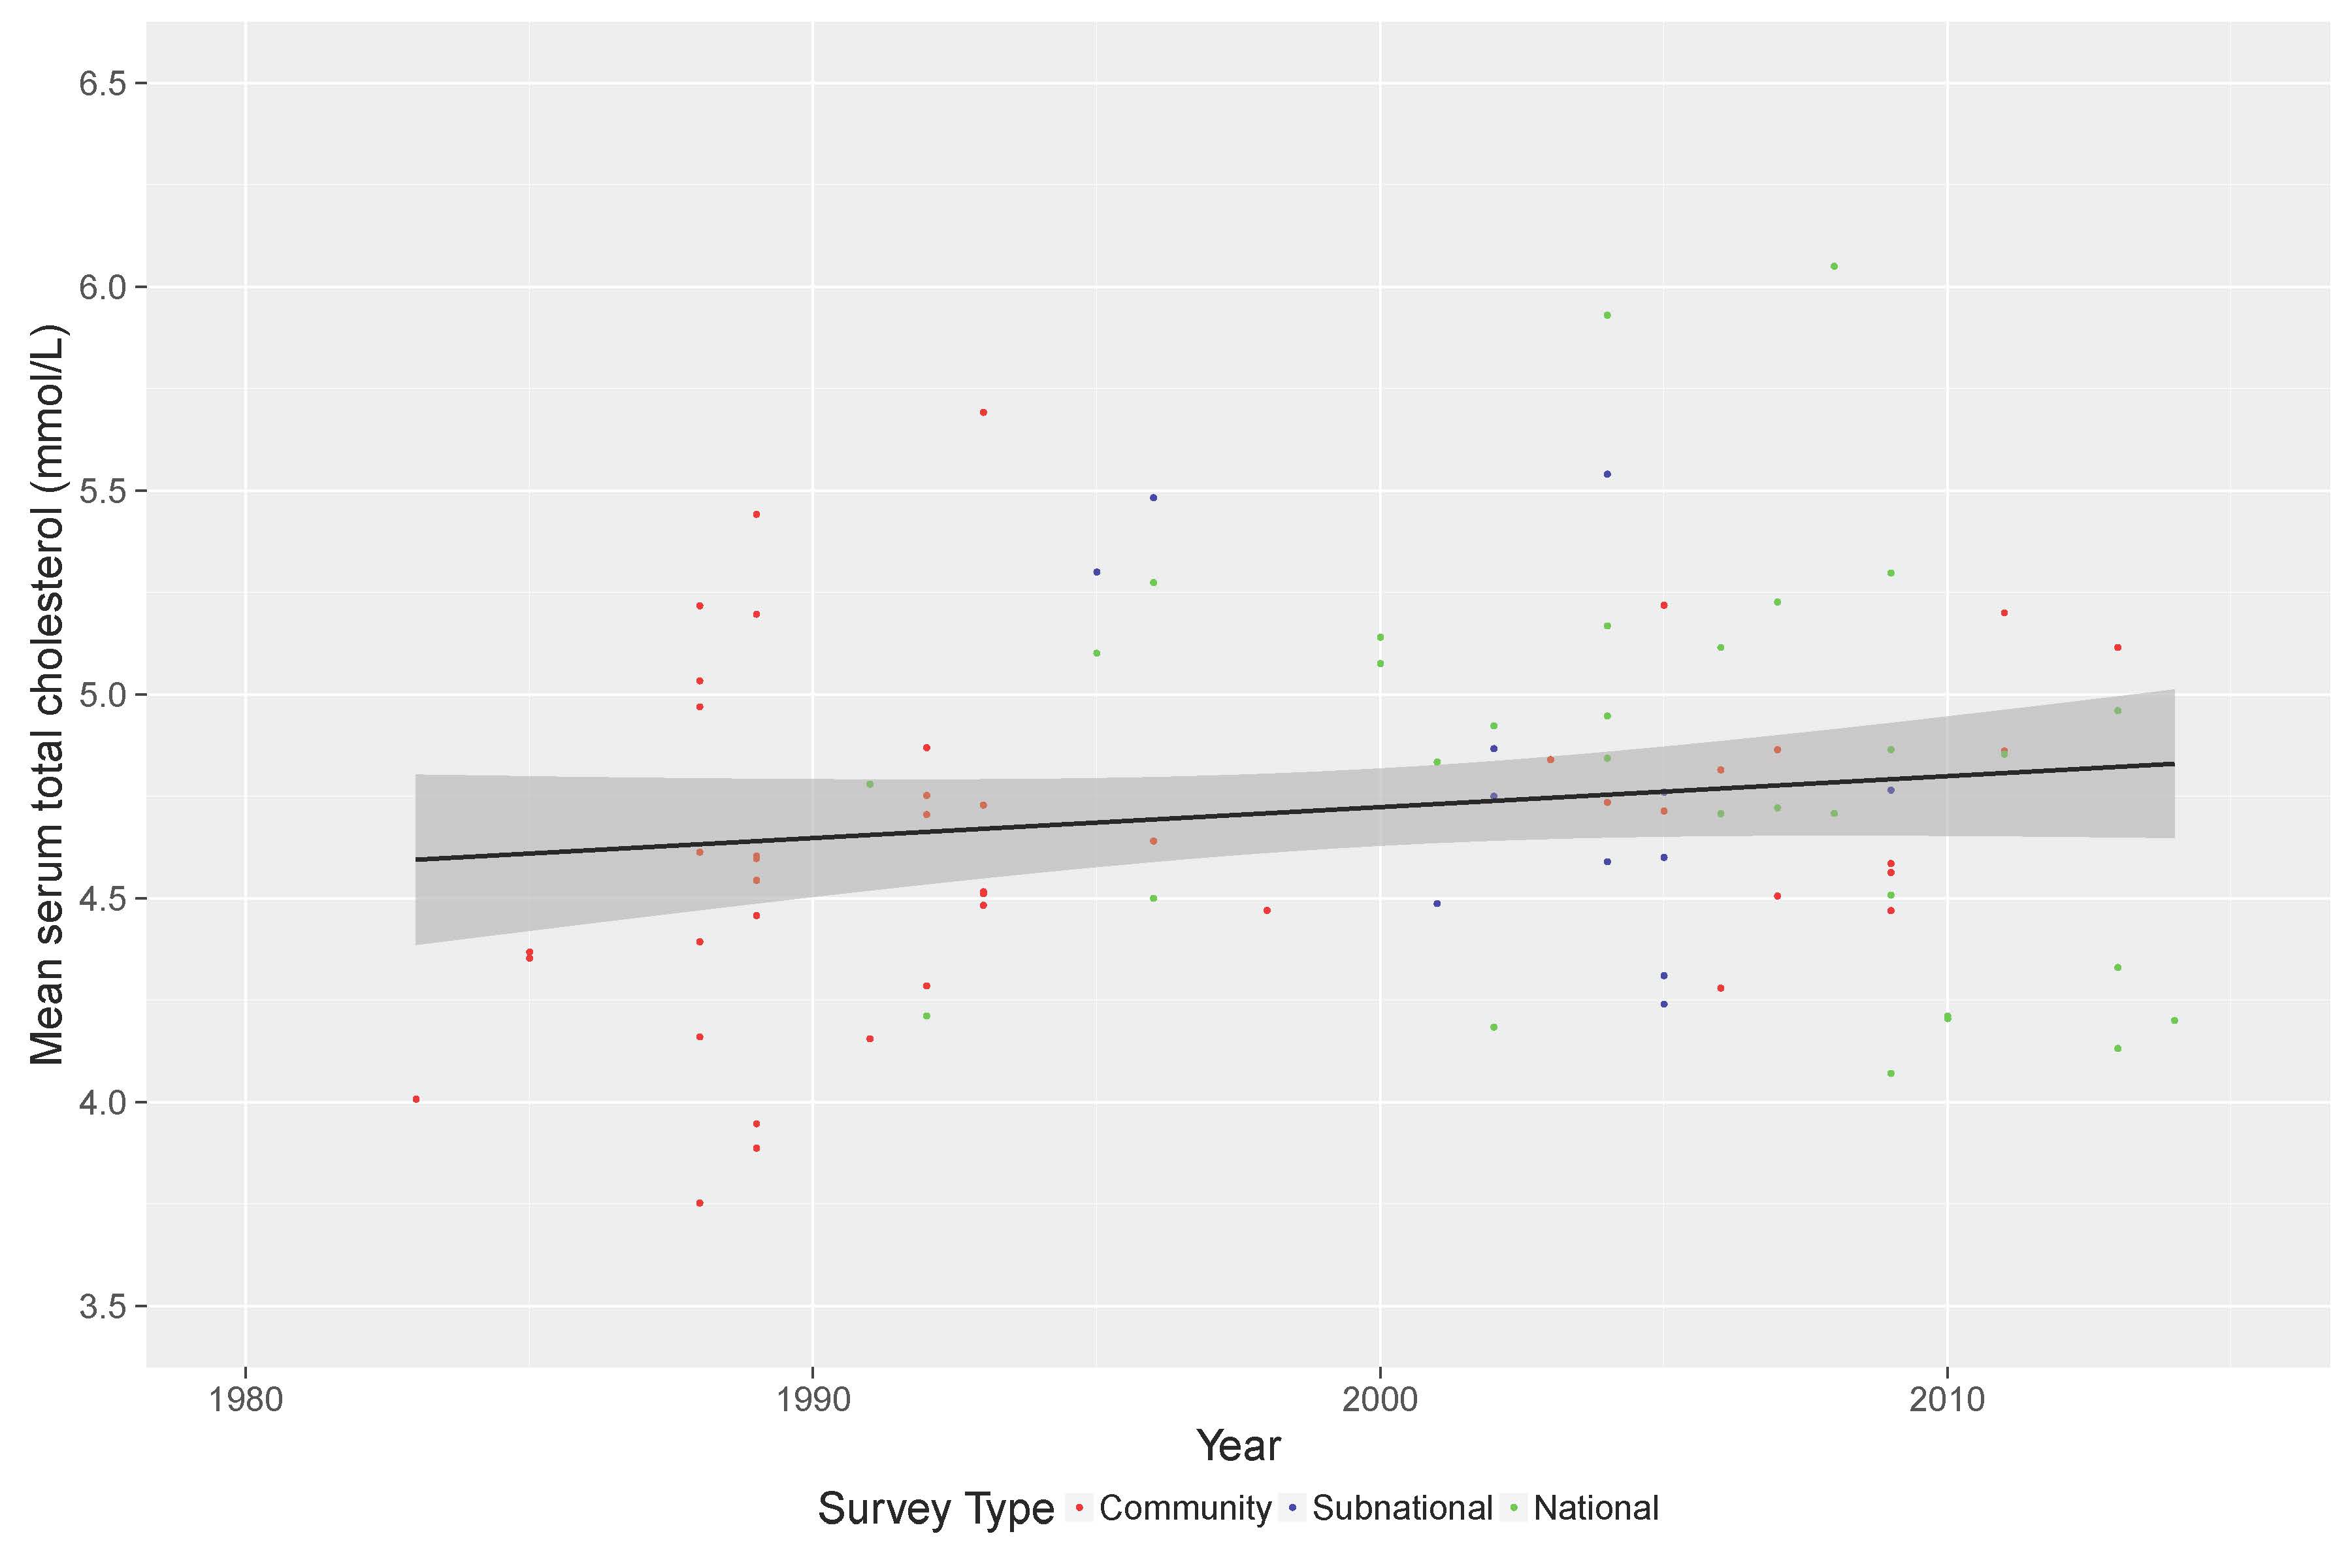
   g <- ggplot(data=data.male, aes(x=mid_year, y=mean_tc, colour=data.male$survey_type))
   g <- g + geom_point(shape = 20, size =2)
   g <- g + geom_smooth(method=lm, na.rm = FALSE, se = TRUE, aes(group=1), colour = "black")
   g <- g + theme_gray(base_size=24)
   g <- g+ xlab("Year")
   g <- g + ylab("Mean serum total cholesterol (mmol/L)")
   g <- g + theme(legend.position="bottom")
   g <- g + scale_y_continuous(limits=c(3.5,6.5), breaks=c(3.5,4,4.5,5,5.5,6,6.5))
   g <- g + scale_x_continuous(limits=c(1980,2015), breaks=c(1980,1990,2000,2010))
   g <- g + scale_colour_manual(name = "Survey Type", values= c("Red", "Blue", "Green"))
   g
1
回答 1
Stack Overflow用户
回答已采纳
发布于 2016-05-21 17:01:14
不要使用绘图功能来建模。使用lm函数对模型进行拟合。
然后使用summary方法获取您需要知道的关于fit的所有信息。
您应该获得与绘图函数相同的结果,我怀疑绘图函数在内部使用lm。
页面原文内容由Stack Overflow提供。腾讯云小微IT领域专用引擎提供翻译支持
原文链接:
https://stackoverflow.com/questions/37365724
复制相关文章
相似问题
腾讯云开发者

Copyright © 2013 - 2026 Tencent Cloud. All Rights Reserved. 腾讯云 版权所有
深圳市腾讯计算机系统有限公司 ICP备案/许可证号:粤B2-20090059 ![]() 粤公网安备44030502008569号
粤公网安备44030502008569号
腾讯云计算(北京)有限责任公司 京ICP证150476号 | 京ICP备11018762号