
dc.js和dc.leaflet.js;返回错误类型的地图
dc.js和dc.leaflet.js;返回错误类型的地图
提问于 2016-05-19 04:44:41
我正在尝试使用dc.js制作一个仪表板。它有一些图表和一个choroplethChart。一切都很顺利,但我需要在地图上加上传单。我跟踪了这个样本并使用了dc.leaflet.js库,但是它没有使用choroplethChart,而是返回标记(见图)。
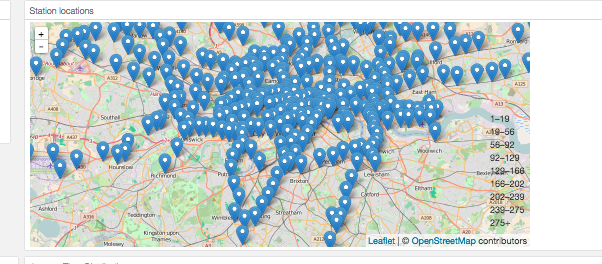
(这是使用传单前的样子)
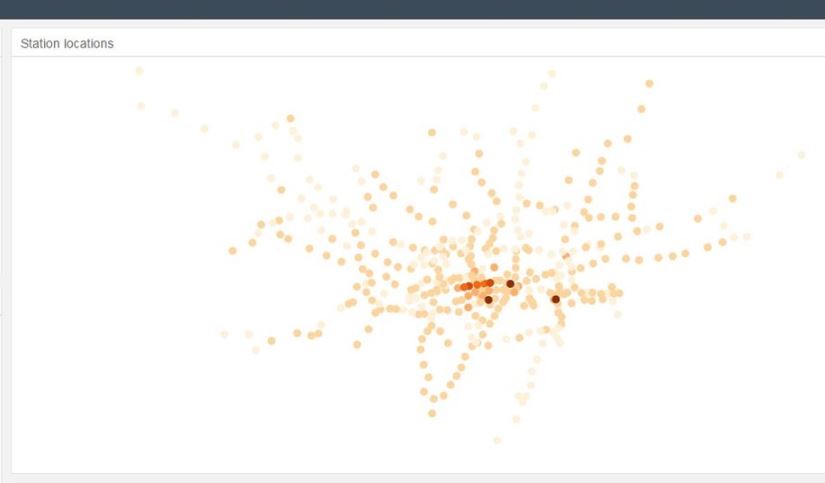
代码在下面,这是geojson居住的地方
var usChart = dc_leaflet.choroplethChart("#us-chart");

usChart.width(1000)
    .height(450)
    .dimension(stateDim)
    .group(totalDemandByStation)
    .center([ 51.4963, -0.143 ])
    .zoom(11)
    .geojson(statesJson)
    .colors(["#E2F2FF", "#C4E4FF", "#9ED2FF", "#81C5FF", "#6BBAFF", "#51AEFF", "#36A2FF", "#1E96FF", "#0089FF", "#0061B5"])
    .colorDomain([0, max_state])
    .colors(['#fff7ec','#fee8c8','#fdd49e','#fdbb84','#fc8d59','#ef6548','#d7301f','#b30000','#7f0000'])
    .colorAccessor(function(d,i) {
          return d.value;
      })
    .featureKeyAccessor(function(feature) {
          return feature.properties.name;
      })
    .renderPopup(true)
    .popup(function(d,feature) {
          return feature.properties.name+" : "+d.value;
      })
    .legend(dc_leaflet.legend().position('bottomright'));

    //https://github.com/dc-js/dc.js/issues/419
    usChart.on("preRender", function(chart) {
        chart.colorDomain(d3.extent(chart.data(), chart.valueAccessor()));
    })
    usChart.on("preRedraw", function(chart) {
        chart.colorDomain(d3.extent(chart.data(), chart.valueAccessor()));
})回答 1
Stack Overflow用户
回答已采纳
发布于 2016-05-19 19:52:57
我不是这里的专家,但是合唱团期待的是地图数据,而不是点数据。您的geojson的特征是:
{
    "crs": {
        "properties": {
            "name": "urn:ogc:def:crs:OGC:1.3:CRS84"
        },
        "type": "name"
    },
    "features": [
        {
            "geometry": {
                "coordinates": [
                    -0.013071299999987,
                    51.510716
                ],
                "type": "Point"
            },
            "properties": {
                "id": "940GZZDLALL",
                "labelX": 30,
                "lines": [
                    {
                        "name": "DLR"
                    }
                ],
                "name": "All Saints",
                "tfl_intid": 850
            },
            "type": "Feature"
        },
        {
            "geometry": {
                "coordinates": [
                    0.061052699999989,
                    51.51427850000001
                ],
                "type": "Point"
            },
            "properties": {
                "id": "940GZZDLBEC",
                "labelX": -30,
                "lines": [
                    {
                        "name": "DLR"
                    }
                ],
                "name": "Beckton",
                "tfl_intid": 895
            },
            "type": "Feature"
        },
...要画出合唱,传单将需要特征,其types是多边形。
所以我猜传单是在划和画标记
页面原文内容由Stack Overflow提供。腾讯云小微IT领域专用引擎提供翻译支持
原文链接:
https://stackoverflow.com/questions/37314104
复制相关文章
相似问题
腾讯云开发者

Copyright © 2013 - 2026 Tencent Cloud. All Rights Reserved. 腾讯云 版权所有
深圳市腾讯计算机系统有限公司 ICP备案/许可证号:粤B2-20090059 ![]() 粤公网安备44030502008569号
粤公网安备44030502008569号
腾讯云计算(北京)有限责任公司 京ICP证150476号 | 京ICP备11018762号