
如何在画布上无模糊地渲染d3.js地图
如何在画布上无模糊地渲染d3.js地图
提问于 2016-05-18 21:47:12
尽管我可能尝试,我一直无法渲染一个d3.js县地图,而不会导致地图显着模糊。
我正在使用通常的技巧:我的canvas样式宽度是属性宽度的一半。我翻译半像素绘图的上下文,以抵消任何不必要的影响。
但它仍然非常模糊。
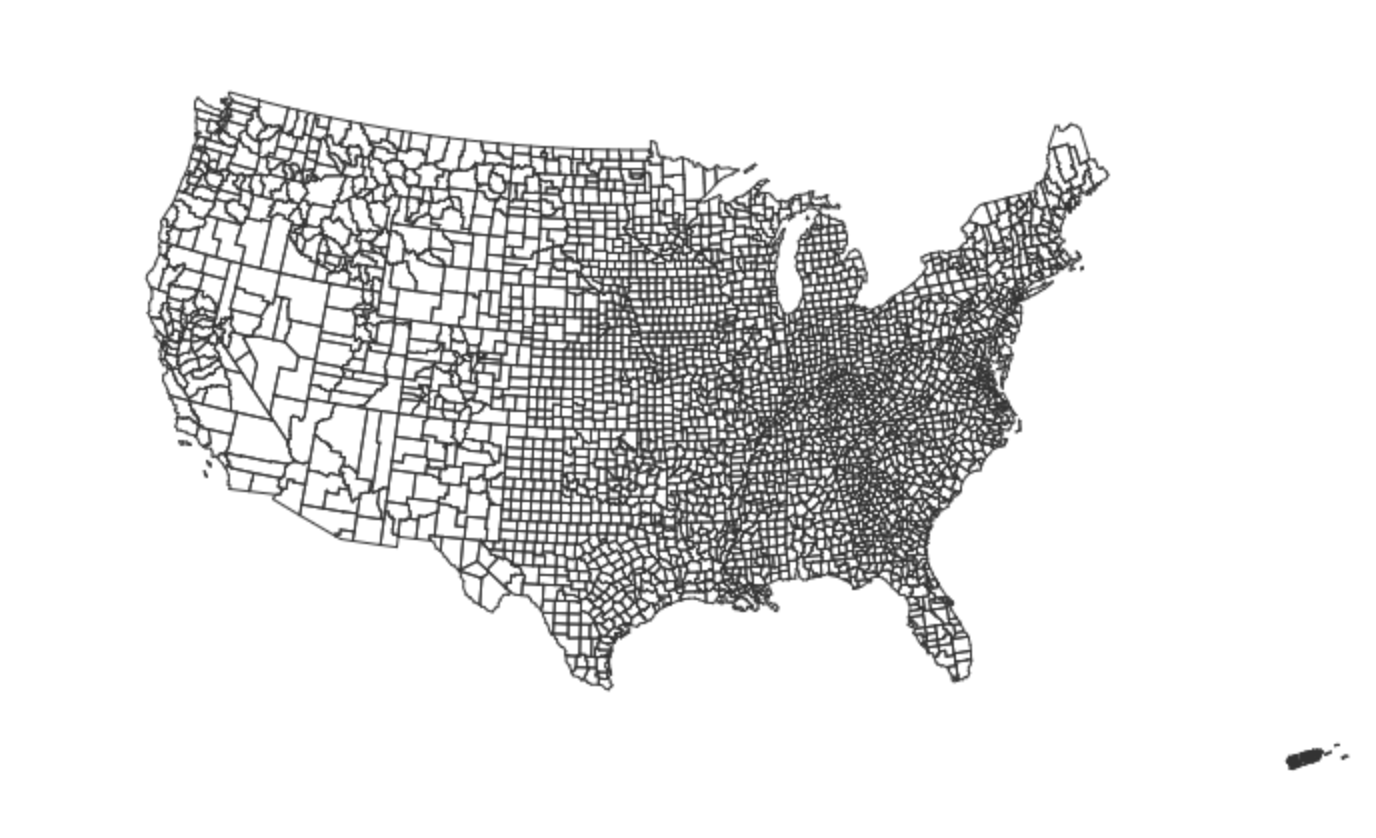
有人能分享为canvas元素制作的清晰d3.js地图的模式吗?
function drawQuintiles() {
  var width = 960,
    height = 500;

  var projection = d3.geo.albers()
      .scale(666);


  var canvas = d3.select("#quintiles")
          .append("canvas")
            .attr("class",'canvasarea');
  var context = canvas.node().getContext("2d");

  var ratio = (window.devicePixelRatio / context.webkitBackingStorePixelRatio) || 1;

  d3.select('.canvasarea')
                .attr("width", width * ratio).attr("height", height * ratio)
                .style("width", width + "px").style("height", height + "px");


   context.scale(ratio, ratio);

  var path = d3.geo.path()
      .projection(projection)
      .context(context);

  d3.json("/data/us-counties.json", function(error, us) {
    if (error) throw error;

    context.strokeStyle = '#333';

    context.beginPath();

    var strokeWidth = 0.5;

    var iTranslate = (strokeWidth % 2) / 2;
    context.translate(iTranslate, 0);

    context.lineWidth = strokeWidth;
    context.lineCap = "round";

    path(topojson.feature(us, us.objects.counties));
    context.stroke();
  });
}回答 1
Stack Overflow用户
回答已采纳
发布于 2016-05-18 22:53:29
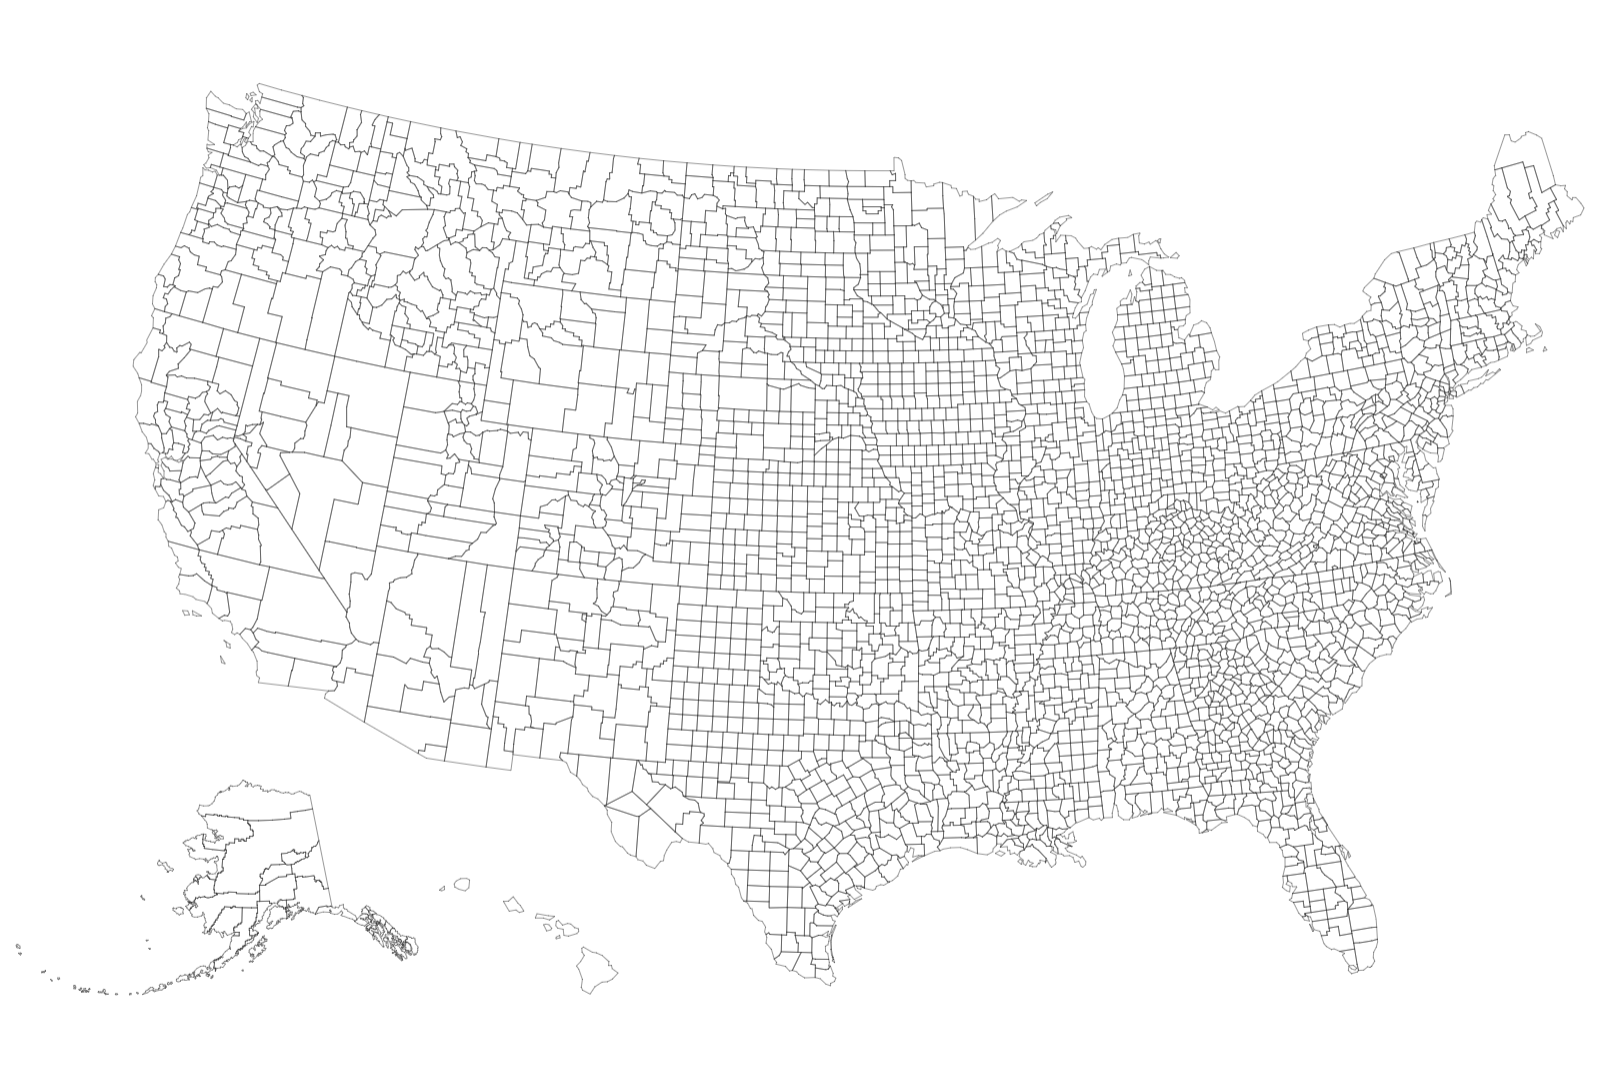
这就是我结束的代码。移除缩放和翻译黑有正确的地图渲染。
function drawQuintiles() {
  var width = 1600;

  d3.json("/data/us-counties.json", function(error, data) {

    var projection = d3.geo.albersUsa();

    var path = d3.geo.path().projection(projection);

    var tracts = topojson.feature(data, data.objects.counties);

    projection.scale(1).translate([0, 0]);

    var b = path.bounds(tracts);

    var whRatio = ((b[1][0] - b[0][0]) / (b[1][1] - b[0][1]));

    var height = (width / 2) * whRatio;


    var s = .98 / Math.max((b[1][0] - b[0][0]) / width, (b[1][1] - b[0][1]) / height),
      t = [(width - s * (b[1][0] + b[0][0])) / 2, (height - s * (b[1][1] + b[0][1])) / 2];

    projection.scale(s).translate(t);


    var canvas = d3.select("#quintiles")
            .append("canvas")
              .attr("class",'canvasarea');
    var context = canvas.node().getContext("2d");


var ratio = window.devicePixelRatio || 1;

d3.select('.canvasarea')
              .attr("width", width ).attr("height", height )
              .style("width", ((width * ratio) ) + "px").style("height", ((height * ratio) ) + "px");


    var path = d3.geo.path()
        .projection(projection)
        .context(context);


    if (error) throw error;

    context.strokeStyle = '#333';

    context.beginPath();

    var strokeWidth = 0.5;

    context.lineWidth = strokeWidth;
    context.lineCap = "round";

    path(topojson.feature(data, data.objects.counties));
    context.stroke();
  });
}

drawQuintiles();页面原文内容由Stack Overflow提供。腾讯云小微IT领域专用引擎提供翻译支持
原文链接:
https://stackoverflow.com/questions/37310637
复制相关文章
相似问题
腾讯云开发者

Copyright © 2013 - 2026 Tencent Cloud. All Rights Reserved. 腾讯云 版权所有
深圳市腾讯计算机系统有限公司 ICP备案/许可证号:粤B2-20090059 ![]() 粤公网安备44030502008569号
粤公网安备44030502008569号
腾讯云计算(北京)有限责任公司 京ICP证150476号 | 京ICP备11018762号