
如何在d3js中创建下一级流程图
如何在d3js中创建下一级流程图
提问于 2016-05-17 16:53:24
我已经创建了一个基本的流程图,但我不知道如何创建下一个层次的流程图。我是附加图像和jsfiddle链接。
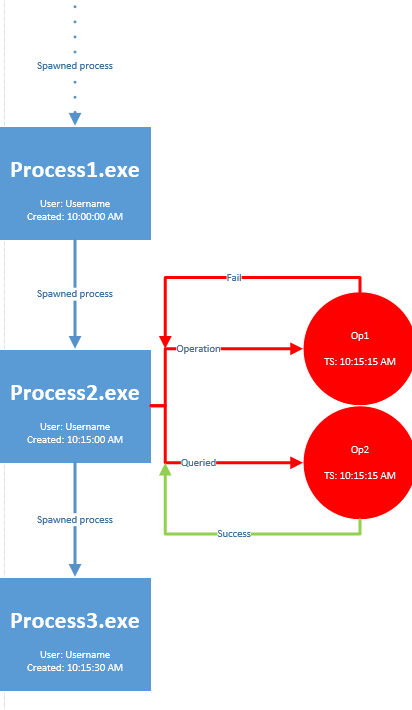
这是数据
 "process":[
            {
            "ProcessName" : "nivprocess.exe",
            "Username" : "Joh Doe",
            "Created" : "10:00:00",
            "processDescription" : null,
            "process_parent" : null,
            "operation" : [
                {
                "operationDescription":"OP1",
                "operationTime":"10:15:15",
                "response":"Fail"
                },{
                "operationDescription":"OP2",
                "operationTime":"10:20:00",
                "response":"Success"
                }
                ],
            },
            {
            "ProcessName" : "Process2.exe",
            "Username" : "Some One",
            "Created" : "11:00:00",
            "processDescription" : null,
            "process_parent" : "process1",
            "operation" : [
                {
                "operationDescription":"OP1",
                "operationTime":"10:15:15",
                "response":"Fail"
                },{
                "operationDescription":"OP2",
                "operationTime":"10:20:00",
                "response":"Success"
                }],
            },
            {
            "ProcessName" : "Process3.exe",
            "Username" : "Nika Boka",
            "Created" : "12:00:00",
            "processDescription" : null,
            "process_parent" : "process2",
            "operation" : [
                {
                "operationDescription":"OP1",
                "operationTime":"10:15:15",
                "response":"Fail"
                },{
                "operationDescription":"OP2",
                "operationTime":"10:20:00",
                "response":"Success"
                }],
            }
]}回答 1
Stack Overflow用户
回答已采纳
发布于 2016-05-17 17:33:44
您正在手动绘制这个图(我假设流程图意味着一个d3布局的图表),您的数据数组有3个数据点,因此这将直接映射到3个绘制的对象。我可以看到您的代码(您也应该附加到这些问题)是用两个rects (标签下的文本)和四个文本为每个数据点绘制线条,但是它没有处理数据点中的任何操作数组。
旁白:我注意到了一些剪辑,在JS小提琴中它帮助我临时设置了一个宽度的svg标记:
<svg style="padding-top: 100px; width:100%" class="chart">有两种方法我可以尝试:
- 创建一个与每个进程rect关联的空
g组,然后var ops = chart.selectAll("g g");找出正确的方法来获得绑定到每个父g的数据点的引用,让dp引用它。然后在每个enter上执行ops.selectAll("g").data(dp.operation).enter().append("g");,将第一行画到叉上。然后在这个组组的组中使用每个操作来绘制两个操作线,操作圈和标签,类似于您以前所做的工作。注意,我对获取dp的引用很模糊。可能是这样的:bar.each(function(dp,i,t){d3.selectAll(t).data(dp.operation).enter().etc;}); - 可能会手动设置正确的选择。假设您在“附加测试”中创建了空的第二个
g,手动设置看起来有点像:data.forEach(function(dp, idx, arr){bar[idx].data(dp.operation).enter().etc;}),在这里,我希望barselectAll的索引与data的索引顺序相同,它们将在数量上匹配。
当我试着使用#1的时候,我最终得到了这个,以达到你想要的地方。这当然不是很漂亮,但是对于每个进程,您可以得到一行到一个组,然后在每个组中为每个操作获得1行(您将不得不添加行、箭头和标签,我得到偏移的方式有点奇怪):
//appending test
  var ops = bar.append("g");
  ops
  .attr("transform", function(d, i) {
      return "translate("+width+",0)";
   });
   ops
    .append('line')
    .attr("x1","0")
    .attr("y1",lineHeight/2)
    .attr("x2",width/8)
    .attr("y2",lineHeight/2)
    //.attr("transform","translate(0,-"+(lineHeight*.85)+")")
    .attr("stroke","#FF0000")
    .attr("stroke-width","4");

  ops.each(
  function(d,i,t){
  if ('object'===typeof this) {
  var op = d3.select(this).selectAll('g').data(d.operation).enter().append("g");
  var xc=1;
  op.append("circle")
    .attr("cx",lineHeight)
    .attr("cy",function(d){return lineHeight/2*xc++-lineHeight/4})
    .attr("r",width/4)
    .attr("fill", "#ff0000");
  var xl1s=1;
  var xl1e=1;
  op.append("line")
    .attr("x1",width/8)
    .attr("y1",function(d){return lineHeight/2-width/4-lineHeight/4*xl1s++})
    .attr("x2",lineHeight)
    .attr("y2",function(d){return lineHeight/2-width/4-lineHeight/4*xl1e++})
    .attr("stroke","#FF0000")
    .attr("stroke-width","4");
}});页面原文内容由Stack Overflow提供。腾讯云小微IT领域专用引擎提供翻译支持
原文链接:
https://stackoverflow.com/questions/37282177
复制相关文章
相似问题
腾讯云开发者

Copyright © 2013 - 2026 Tencent Cloud. All Rights Reserved. 腾讯云 版权所有
深圳市腾讯计算机系统有限公司 ICP备案/许可证号:粤B2-20090059  粤公网安备44030502008569号
腾讯云计算(北京)有限责任公司 京ICP证150476号 | 京ICP备11018762号