
防止不等维w/ sharex不显影子图的截止
防止不等维w/ sharex不显影子图的截止
提问于 2016-05-09 21:25:28
我有几个想用imshow显示的矩阵,以相同图形的子图显示。它们都有相同的列数,但行数各不相同。我想:
- 使用
imshow显示时,请查看所有矩阵 - 保留
aspect=1效应的imshow - 在图中使用
sharex
(这意味着子图的高度反映了矩阵中不同的行数)。我尝试使用gridspec (通过plt.subplots的gridspec_kw参数),但是sharex和aspect=1的组合会导致部分矩阵被切断,除非我手动调整窗口的大小。示例:
import numpy as np
import matplotlib.pyplot as plt
# fake data
foo = np.arange(5 * 7).reshape(5, 7)
bar = np.arange(11 * 7).reshape(11, 7)
baz = np.arange(3 * 7).reshape(3, 7)

data = [foo, bar, baz]
nrows = [x.shape[0] for x in data]
row_labels = np.array([x for x in 'abcdefghijk'])
col_labels = [x for x in 'ABCDEFG']

# initialize figure
fig, axs = plt.subplots(3, 1, squeeze=False, sharex=True,
                        gridspec_kw=dict(height_ratios=nrows))

for ix, d in enumerate(data):
    ax = axs[ix % axs.shape[0], ix // axs.shape[0]]
    _ = ax.imshow(d)
    _ = ax.yaxis.set_ticks(range(d.shape[0]))
    _ = ax.xaxis.set_ticks(range(d.shape[1]))
    _ = ax.yaxis.set_ticklabels(row_labels[np.arange(d.shape[0])])
    _ = ax.xaxis.set_ticklabels(col_labels)
根据每个矩阵中的行数,我可以猜到一个大概的数字维,它应该使它们都可见,但是它不起作用:
figsize = (foo.shape[1], sum(nrows))
fig, axs = plt.subplots(3, 1, squeeze=False, sharex=True,
gridspec_kw=dict(height_ratios=nrows),
figsize=figsize)
for ix, d in enumerate(data):
ax = axs[ix % axs.shape[0], ix // axs.shape[0]]
_ = ax.imshow(d)
_ = ax.yaxis.set_ticks(range(d.shape[0]))
_ = ax.xaxis.set_ticks(range(d.shape[1]))
_ = ax.yaxis.set_ticklabels(row_labels[np.arange(d.shape[0])])
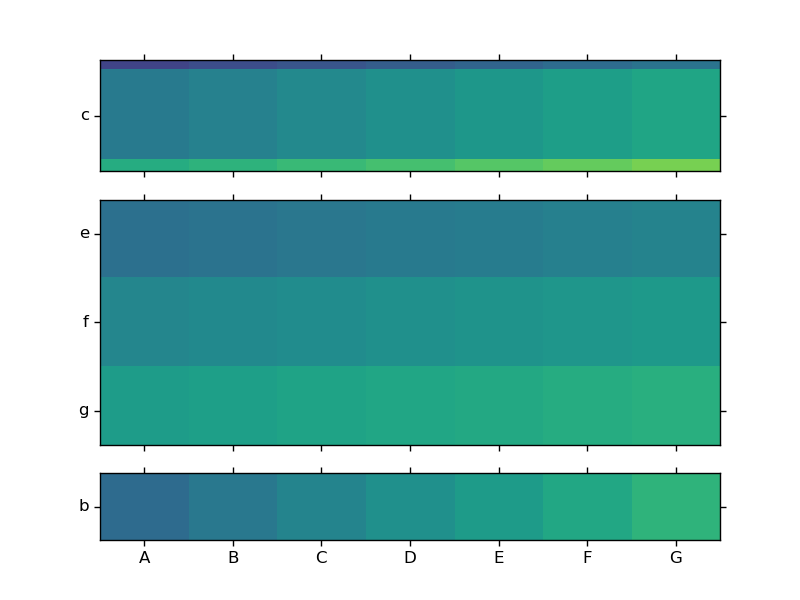
_ = ax.xaxis.set_ticklabels(col_labels)请注意所有三个子图的顶部和底部行是如何被部分切断的(在中间的部分最容易看到),然而在顶部和底部的数字边距上有大量多余的空白:
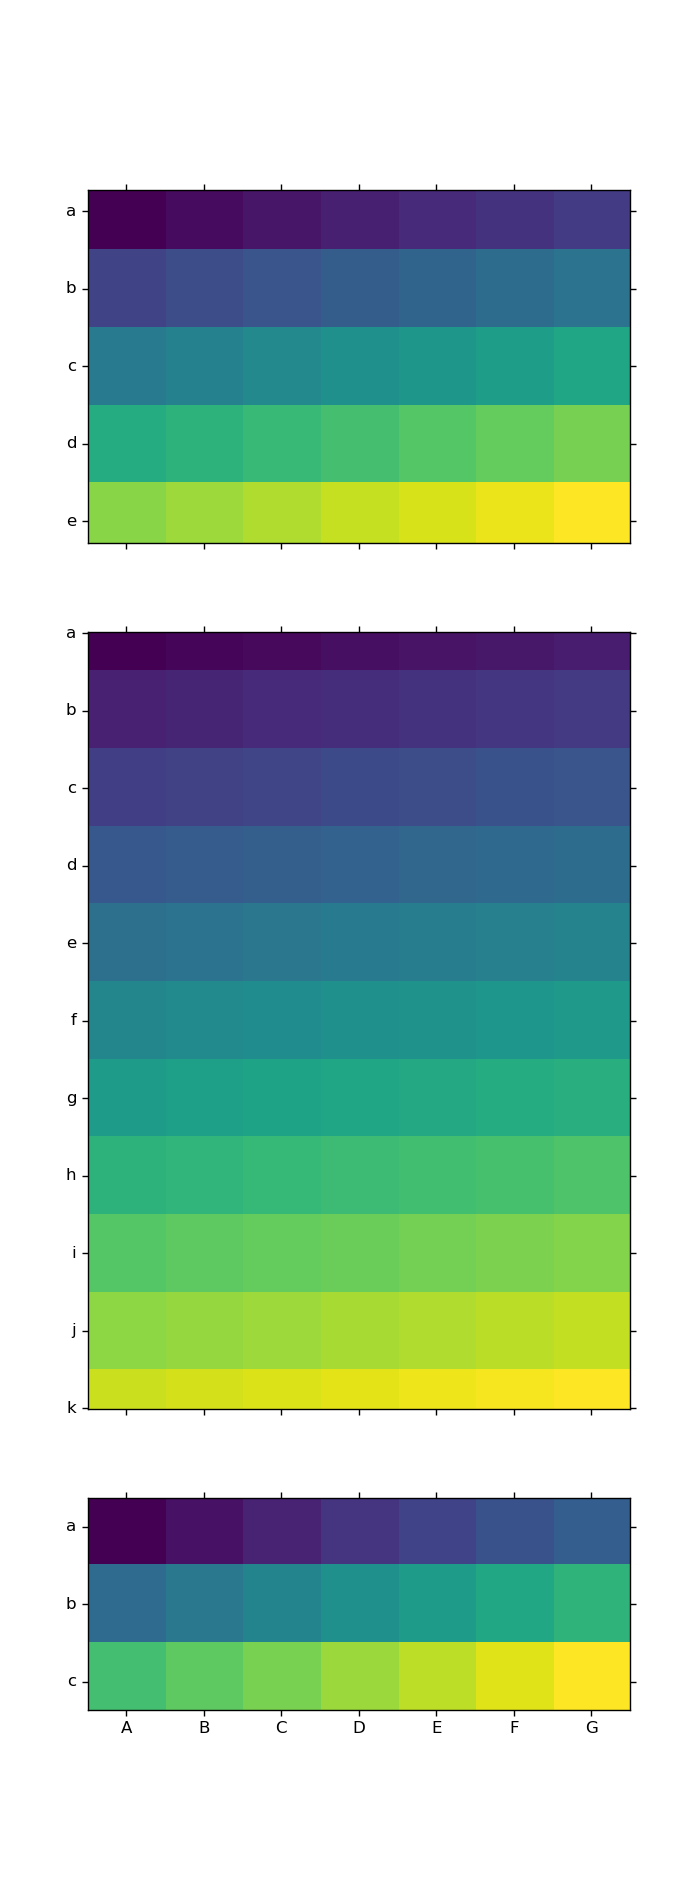
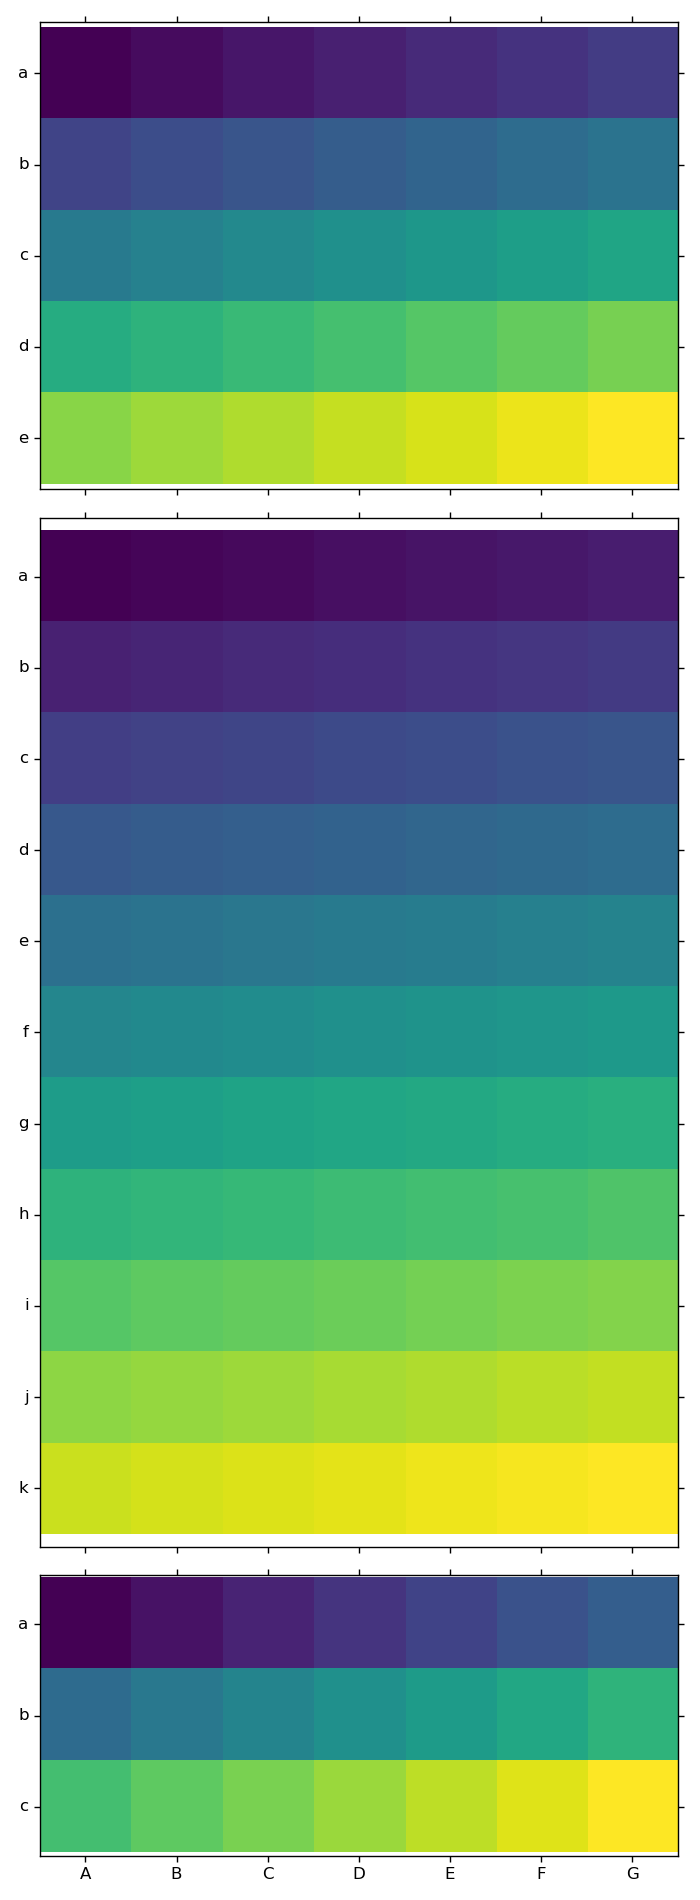
使用tight_layout也不能解决这个问题;它使子图太大(注意每个子图的上/下在轴、脊和图像之间的间隙):
有什么办法让imshow和sharex在这里和谐地工作吗?
回答 1
Stack Overflow用户
回答已采纳
发布于 2016-05-10 00:13:13
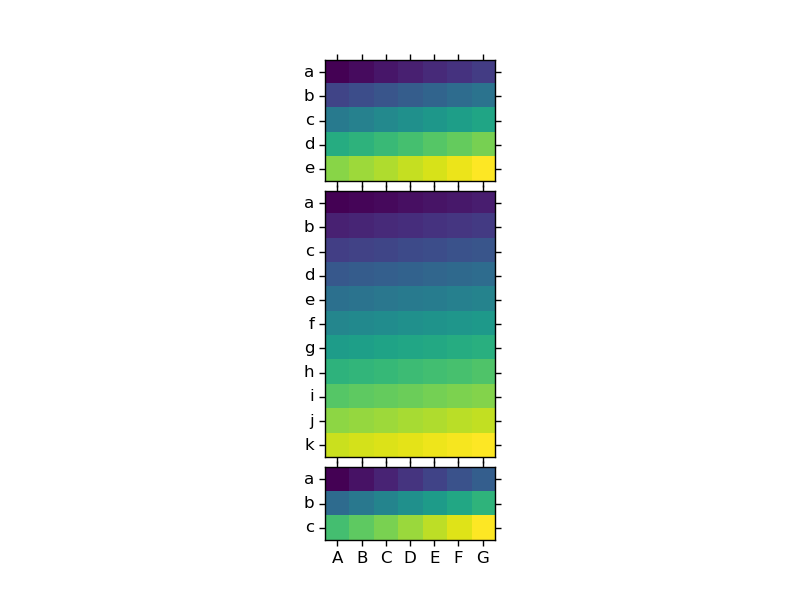
我刚刚发现了ImageGrid,它做得很好。完整的例子:
import numpy as np
import matplotlib.pyplot as plt
from mpl_toolkits.axes_grid1 import ImageGrid
foo = np.arange(5 * 7).reshape(5, 7)
bar = np.arange(11 * 7).reshape(11, 7)
baz = np.arange(3 * 7).reshape(3, 7)
data = [foo, bar, baz]
nrows = [x.shape[0] for x in data]
row_labels = np.array([x for x in 'abcdefghijk'])
col_labels = [x for x in 'ABCDEFG']
fig = plt.figure()
axs = ImageGrid(fig, 111, nrows_ncols=(3, 1), axes_pad=0.1)
for ix, d in enumerate(data):
    ax = axs[ix]
    _ = ax.imshow(d)
    _ = ax.yaxis.set_ticks(range(d.shape[0]))
    _ = ax.xaxis.set_ticks(range(d.shape[1]))
    _ = ax.yaxis.set_ticklabels(row_labels[np.arange(d.shape[0])])
    _ = ax.xaxis.set_ticklabels(col_labels)
页面原文内容由Stack Overflow提供。腾讯云小微IT领域专用引擎提供翻译支持
原文链接:
https://stackoverflow.com/questions/37125751
复制相关文章
相似问题
腾讯云开发者

Copyright © 2013 - 2026 Tencent Cloud. All Rights Reserved. 腾讯云 版权所有
深圳市腾讯计算机系统有限公司 ICP备案/许可证号:粤B2-20090059 ![]() 粤公网安备44030502008569号
粤公网安备44030502008569号
腾讯云计算(北京)有限责任公司 京ICP证150476号 | 京ICP备11018762号