
Ggplot2中的密度直方图:标杆高度
我有数据可以告诉我解决一项任务所需的时间:
dat = data.frame(a = c(5.5,7,4,20,4.75,6,5,8.5,10,10.5,13.5,14,11))我用ggplot2包绘制了数据的密度直方图:
p=ggplot(dat, aes(x=a)) + geom_histogram(aes(y=..density..),breaks = seq(4,20,by=2))+xlab("Required Solving Time")现在我想在上面添加每一个密度杆高度的标签。我试图通过添加+geom_text(label=..density..)来达到这个目的。这将返回错误
对象‘..density.’未找到
然而。有人知道在我的例子中,geom_text()函数的输入必须是什么才能得到这些标签吗?
没有geom_text()的解决方案也不错,但我更愿意停留在ggplot2包中。
回答 3
Stack Overflow用户
发布于 2016-05-07 17:16:43
你可以用ggplot_build()来做
library(ggplot2)
dat = data.frame(a = c(5.5,7,4,20,4.75,6,5,8.5,10,10.5,13.5,14,11))
p=ggplot(dat, aes(x=a)) +
geom_histogram(aes(y=..density..),breaks = seq(4,20,by=2))+xlab("Required Solving Time")
ggplot_build(p)$data
#[[1]]
# y count x xmin xmax density ncount ndensity PANEL group ymin ymax colour fill size linetype alpha
#1 0.19230769 5 5 4 6 0.19230769 1.0 26.0 1 -1 0 0.19230769 NA grey35 0.5 1 NA
#2 0.03846154 1 7 6 8 0.03846154 0.2 5.2 1 -1 0 0.03846154 NA grey35 0.5 1 NA
#3 0.07692308 2 9 8 10 0.07692308 0.4 10.4 1 -1 0 0.07692308 NA grey35 0.5 1 NA
#4 0.07692308 2 11 10 12 0.07692308 0.4 10.4 1 -1 0 0.07692308 NA grey35 0.5 1 NA
#5 0.07692308 2 13 12 14 0.07692308 0.4 10.4 1 -1 0 0.07692308 NA grey35 0.5 1 NA
#6 0.00000000 0 15 14 16 0.00000000 0.0 0.0 1 -1 0 0.00000000 NA grey35 0.5 1 NA
#7 0.00000000 0 17 16 18 0.00000000 0.0 0.0 1 -1 0 0.00000000 NA grey35 0.5 1 NA
#8 0.03846154 1 19 18 20 0.03846154 0.2 5.2 1 -1 0 0.03846154 NA grey35 0.5 1 NA
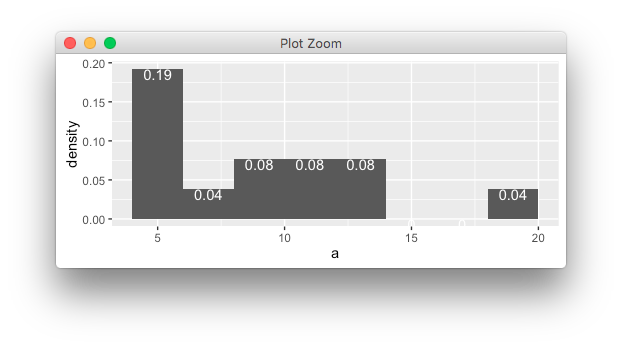
p + geom_text(data = as.data.frame(ggplot_build(p)$data),
aes(x=x, y= density , label = round(density,2)),
nudge_y = 0.005)Stack Overflow用户
发布于 2016-05-07 17:18:14
您可以使用stat_bin和geom="text"标记这些条形图。stat_bin计算计数,我们使用..density..将其转换为密度,就像计算geom_histogram一样。但是通过设置geom="text",我们将这些密度值显示为文本。我们还需要为geom_histogram和stat_bin设置相同的geom_histogram和stat_bin,以使密度值与之匹配。通过将..density..乘以标签中的0.5,我将文本标签放在条形图的中间。不过,你当然可以随意调整这一点。
breaks = seq(4,20,by=2)

ggplot(dat, aes(x=a)) +
  geom_histogram(aes(y=..density..), breaks = breaks) +
  stat_bin(geom="text", aes(label=round(..density..,2), y=0.5*..density..),
           breaks=breaks, colour="white") +
  xlab("Required Solving Time")
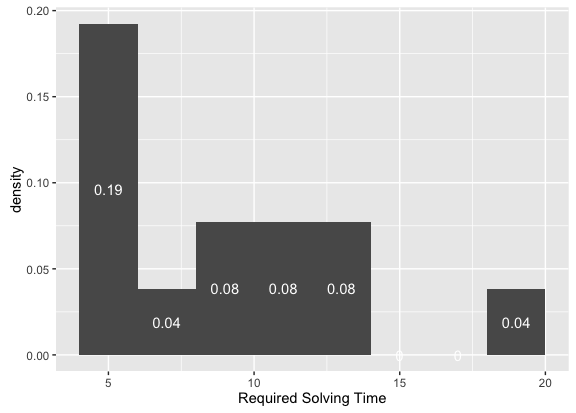
要使标签就在栏杆上方,您可以使用:
ggplot(dat, aes(x=a)) +
  geom_histogram(aes(y=..density..), breaks = breaks) +
  stat_bin(geom="text", aes(label=round(..density..,2), y=..density..),
           breaks=breaks, vjust = -1) +
  xlab("Required Solving Time")
Stack Overflow用户
发布于 2016-05-08 00:50:34
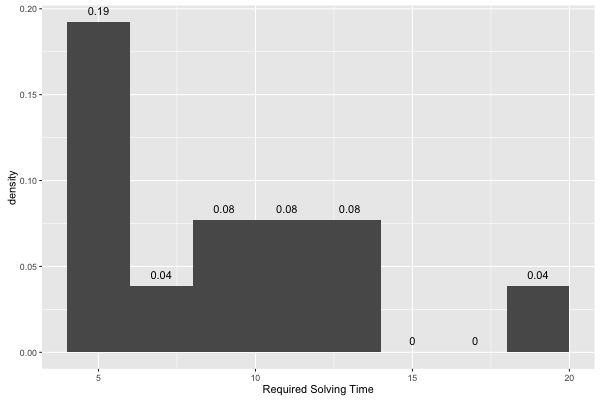
..density..来自于stat,所以您需要告诉这个层也使用一个二进制统计信息,
p + geom_text(aes(label=round(..density.., 2), y=..density..),
              stat="bin", breaks = seq(4,20,by=2),
              col="white", vjust=1)
https://stackoverflow.com/questions/37091322
复制相似问题
腾讯云开发者

Copyright © 2013 - 2026 Tencent Cloud. All Rights Reserved. 腾讯云 版权所有
深圳市腾讯计算机系统有限公司 ICP备案/许可证号:粤B2-20090059 ![]() 粤公网安备44030502008569号
粤公网安备44030502008569号
腾讯云计算(北京)有限责任公司 京ICP证150476号 | 京ICP备11018762号