
清理黄褐色地块(X)
我想形象化tan(xi) = tanh(xi), xi>0的根和我的情节
plot(tan(pi*xi), tanh(pi*xi), (xi, 0, 4), ylim=(-1, 2))像这样出来
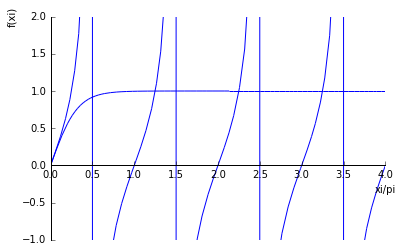
当你看到实际的根时,xi_i \approx pi*(n+1/4), n=1, ...和pi*(n+1/2)上的假根,这就是为什么sympy绘图算法在正负无穷远之间划出一条垂直线的原因。
我试图避免自适应抽样,并使用低采样率,但没有效果。其他程序,如gnuplot,给我一个更合理的计划,至少考虑到我的担心,那就是……
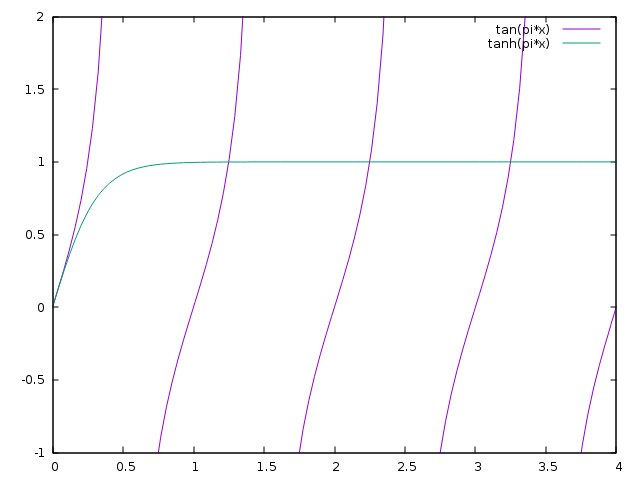
最后,我的问题是,是否有可能避免sympy的plot()函数中的垂直线?
回答 2
Stack Overflow用户
发布于 2016-04-17 19:35:21
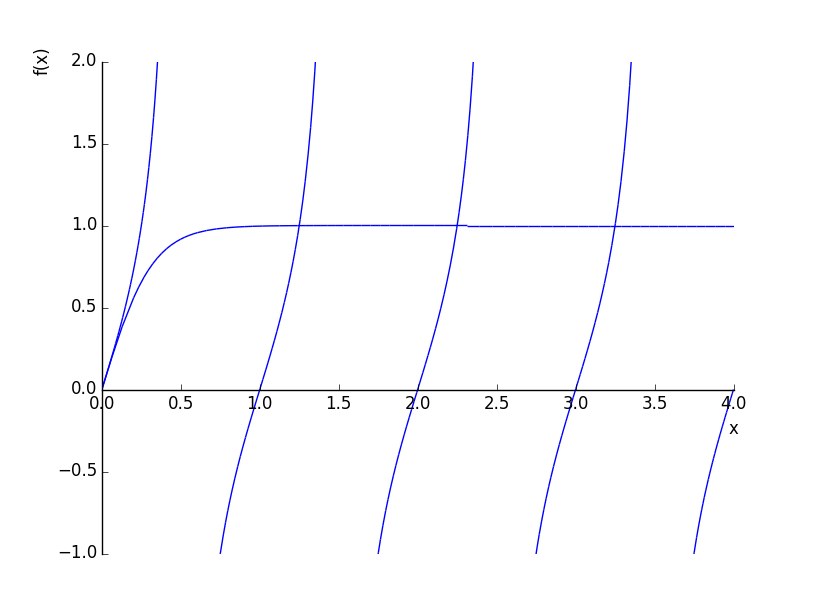
Sympy使用matplotlib作为绘图的后端;根本原因是matplotlib将点连在一个奇点周围。如果一个图是用numpy绘制的,那么直接访问所绘制的y-值就允许一个人使用replace overly large numbers with nan or infinity。如果保持在同情内,这种对数字的严格控制似乎是不可用的。我所能做的最好的就是利用对特定函数tan(pi*x)的知识,将范围划分为不包含奇点的较小范围的列表:
import math
from sympy import *
xi = symbols('xi')
xmin = 0
xmax = 4
ranges = [(xi, n-0.499, n+0.499) for n in range(math.ceil(xmin+0.5), math.floor(xmax+0.5))]
ranges.insert(0, (xi, 0, 0.499))
ranges.append((xi, math.floor(xmax+0.5) - 0.499, xmax))
plot((tanh(pi*xi), (xi, xmin, xmax)), *[(tan(pi*xi), ran) for ran in ranges], ylim=(-1, 2))
输出:
Stack Overflow用户
发布于 2022-09-14 21:50:07
当一条曲线有奇点时,它可以用分段绘制,不包括奇异点。每个奇点周围的一个很小的间隔是用math.nextafter(a,b)构建的,它返回a加上浮动的最小增量,方向是b。
from sympy import init_printing, symbols, plot
from sympy import singularities, Interval, tan, pi
from math import nextafter

init_printing()
x = symbols('x')

# The function to plot
y = tan(pi*x)

# Split x range at x singularities
min_x = next_x = 0
max_x = 4 # 4*pi
segments = []
undefs = singularities(y, x, domain=Interval(min_x, max_x))
for u in undefs:
    # Add a subrange up to singularity for singularities within x range
    if (u >= min_x) and (u <= max_x):
        segments.append((x, next_x, nextafter(u, u-1)))
        next_x = nextafter(u, u+1)
# Add last segment
if u <= max_x: segments.append((x, next_x, max_x))

# Plot all segments
plots = plot(*[(y, segment) for segment in segments], ylim=(-2,2), show=False)
plots.aspect_ratio = (1,1)
plots.show()
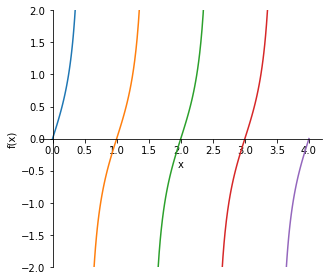
当然,每个曲线段都可以使用相同的颜色。
https://stackoverflow.com/questions/36674713
复制相似问题
腾讯云开发者

Copyright © 2013 - 2026 Tencent Cloud. All Rights Reserved. 腾讯云 版权所有
深圳市腾讯计算机系统有限公司 ICP备案/许可证号:粤B2-20090059  粤公网安备44030502008569号
腾讯云计算(北京)有限责任公司 京ICP证150476号 | 京ICP备11018762号