
高斯混合模型( sklearn.mixture.GMM )的问题
高斯混合模型( sklearn.mixture.GMM )的问题
提问于 2016-04-14 16:01:32
我是新来的.李尔和GMM .对于python中高斯混合模型的拟合质量,我有一些问题。
我有一个数据数组,您可以在这里的数据上找到它,我想要与具有n=2个组件的GMM相匹配。
作为基准,我叠加了一个正常的契合。
错误/怪异:
- 设置n=1个组件,我无法用GMM(1)恢复正常的基准匹配
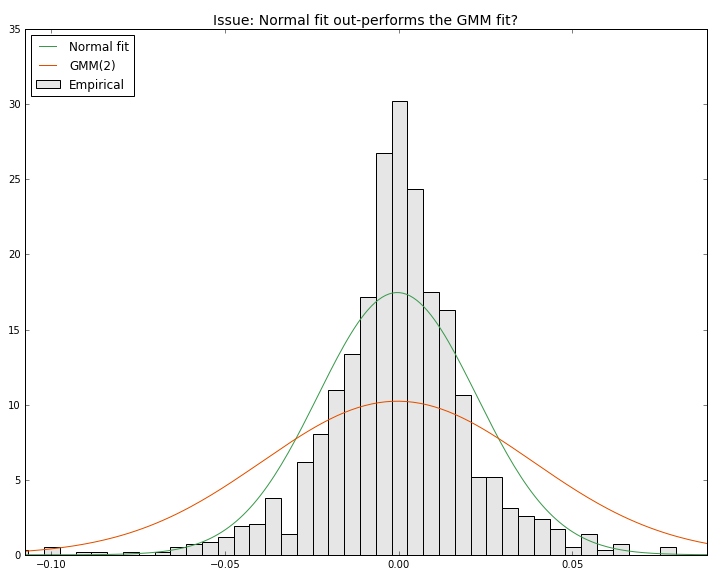
- 设定n=2分量时,法向拟合优于GMM(2)拟合。
- GMM(n)似乎总是提供同样的适合..。
我得到的是:我在这里做错了什么?(图片显示与GMM(2)相吻合)。提前谢谢你的帮助。
下面的代码(要运行它,请将数据保存在同一个文件夹中)
from numpy import *
import pandas as pd
import matplotlib.pyplot as plt
from datetime import datetime
from collections import OrderedDict
from scipy.stats import norm
from sklearn.mixture import GMM

# Upload the data: "epsi" (array of floats)
file_xlsx = './db_X.xlsx'
data = pd.read_excel(file_xlsx)
epsi = data["epsi"].values;
t_   = len(epsi);

# Normal fit (for benchmark)
epsi_grid = arange(min(epsi),max(epsi)+0.001,0.001);

mu     = mean(epsi);
sigma2 = var(epsi);

normal = norm.pdf(epsi_grid, mu, sqrt(sigma2));

# TENTATIVE - Gaussian mixture fit
gmm = GMM(n_components = 2); # fit quality doesn't improve if I set: covariance_type = 'full'
gmm.fit(reshape(epsi,(t_,1)));

gauss_mixt = exp(gmm.score(reshape(epsi_grid,(len(epsi_grid),1))));

# same result if I apply the definition of pdf of a Gaussian mixture:
# pdf_mixture = w_1 * N(mu_1, sigma_1) + w_2 * N(mu_2, sigma_2)
# as suggested in:
# http://stackoverflow.com/questions/24878729/how-to-construct-and-plot-uni-variate-gaussian-mixture-using-its-parameters-in-p
#
#gauss_mixt = array([p * norm.pdf(epsi_grid, mu, sd) for mu, sd, p in zip(gmm.means_.flatten(), sqrt(gmm.covars_.flatten()), gmm.weights_)]);
#gauss_mixt = sum(gauss_mixt, axis = 0);


# Create a figure showing the comparison between the estimated distributions

# setting the figure object
fig = plt.figure(figsize = (10,8))
fig.set_facecolor('white')
ax = plt.subplot(111)

# colors
red   = [0.9, 0.3, 0.0];
grey  = [0.9, 0.9, 0.9];
green = [0.2, 0.6, 0.3];

# x-axis limits
q_inf = float(pd.DataFrame(epsi).quantile(0.0025));
q_sup = float(pd.DataFrame(epsi).quantile(0.9975));
ax.set_xlim([q_inf, q_sup])

# empirical pdf of data
nb     = int(10*log(t_));
ax.hist(epsi, bins = nb, normed = True, color = grey, edgecolor = 'k', label = "Empirical");

# Normal fit
ax.plot(epsi_grid, normal, color = green, lw = 1.0, label = "Normal fit");

# Gaussian Mixture fit
ax.plot(epsi_grid, gauss_mixt, color = red, lw = 1.0, label = "GMM(2)");

# title
ax.set_title("Issue: Normal fit out-performs the GMM fit?", size = 14)

# legend
ax.legend(loc='upper left');

plt.tight_layout()
plt.show()回答 1
Stack Overflow用户
回答已采纳
发布于 2016-04-18 11:03:07
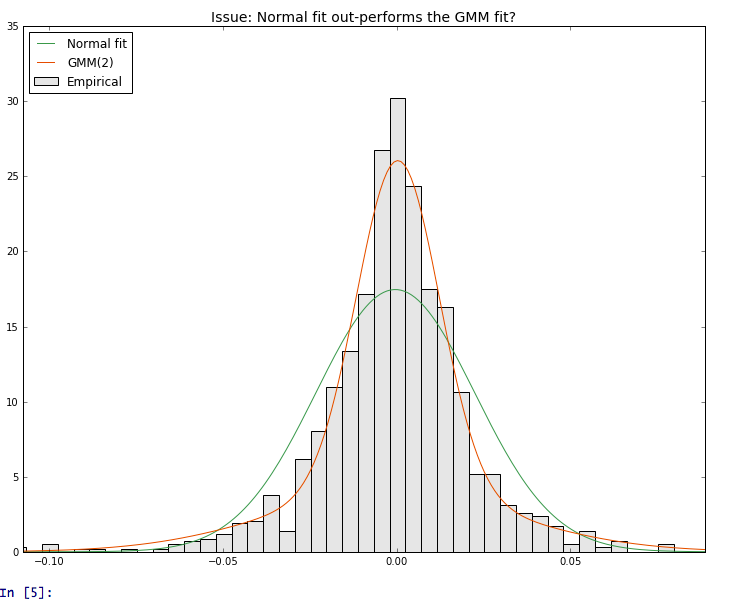
问题在于单个组件变量min_covar上的绑定,这是默认的1e-3,其目的是防止过度拟合。
降低这一限制解决了问题(见图):
gmm = GMM(n_components = 2, min_covar = 1e-12)
页面原文内容由Stack Overflow提供。腾讯云小微IT领域专用引擎提供翻译支持
原文链接:
https://stackoverflow.com/questions/36628291
复制相关文章
相似问题
腾讯云开发者

Copyright © 2013 - 2026 Tencent Cloud. All Rights Reserved. 腾讯云 版权所有
深圳市腾讯计算机系统有限公司 ICP备案/许可证号:粤B2-20090059 ![]() 粤公网安备44030502008569号
粤公网安备44030502008569号
腾讯云计算(北京)有限责任公司 京ICP证150476号 | 京ICP备11018762号