
如何在chart.js的传说中设置标题?
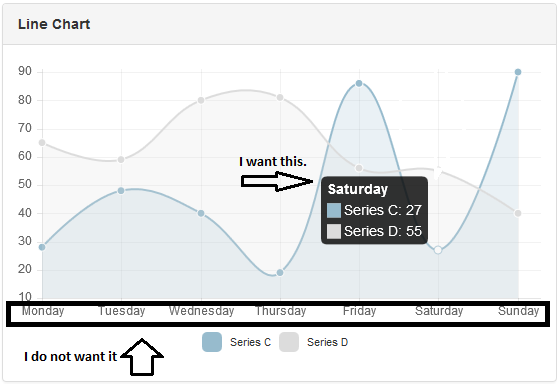
我使用的角度-chart与chart.js,并希望应用标题标题时,鼠标越过线。我想在鼠标时把标题放在标题中,我可以用标签来做,但在图形名称下面出现,我不想要它,如何删除图表上的名称,只留下图例的标题?
 $scope.labels = ["January", "February", "March", "April", "May",    "June", "July"];
   $scope.series = ['Series A', 'Series B'];
    $scope.data = [
  [65, 59, 80, 81, 56, 55, 40],
   [28, 48, 40, 19, 86, 27, 90]
 ];
 $scope.onClick = function (points, evt) {
console.log(points, evt);
 };
 });
我想删除这些文字下面的图表,并只留下标题上的传奇。见图像。有可能吗?
参考资料:http://jtblin.github.io/angular-chart.js/
JsFidle:http://jsfiddle.net/Lfmhcab3/4/
回答 4
Stack Overflow用户
发布于 2016-04-11 20:31:13
预览
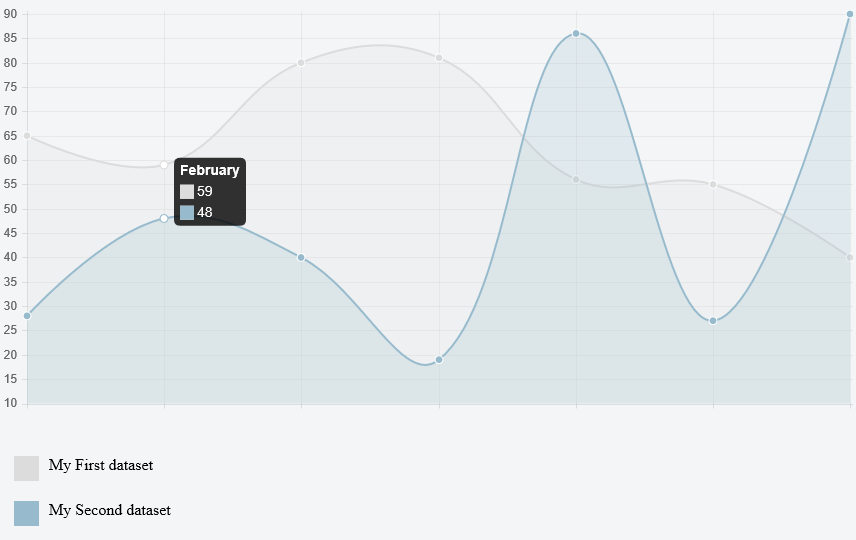
只需在chart.js包含之后添加以下脚本。在线解释。
var originalLineInitialize = Chart.types.Line.prototype.initialize;
Chart.types.Line.prototype.initialize = function(data) {
    // we don't want the labels to separate the x axis from the bottom edge of the graph
    var originalLabels = data.labels;
    data.labels = data.labels.map(function() { return '' });

    originalLineInitialize.apply(this, arguments);

    // restore the original labels - because tooltips pick it up from these properties
    var xLabels = this.scale.xLabels;
    for (var i = 0; i < xLabels.length; i++)
        xLabels[i] = originalLabels[i];
    this.datasets.forEach(function(dataset) {
      dataset.points.forEach(function(point, i) {
        point.label = originalLabels[i];
      });
    });

    // override the scale drawing to set the labels to null before drawing
    // and back to their original values after the scale is drawn
    var originalScaleDraw = this.scale.draw;
    this.scale.draw = function() {
      // we construct the originalLabels instead of using the previous one
      // this allows us to take care of any label updates (eg. in the angular directive)
      for (var i = 0; i < this.xLabels.length; i++) {
        originalLabels[i] = this.xLabels[i];
        this.xLabels[i] = '';
      }
        originalScaleDraw.apply(this, arguments);
      for (var i = 0; i < this.xLabels.length; i++)
        this.xLabels[i] = originalLabels[i];
    }
}Stack Overflow用户
发布于 2016-04-11 16:47:39
如果我正确地理解了您的问题,您希望在JSFiddle中保留相同的工具提示,您只想将标签隐藏在图形的底部。可悲的是,它不会是微不足道的,因为底部显示的标签与工具提示中可以看到的标签相链接。
对于删除chart.js中的标签,您可以执行$scope.labels = ["", "", "", "", "", "", ""];,但是它将导致工具提示中标题的丢失。
作为解决办法,您有两个解决方案:
#1:快速但肮脏
按照@MichaelG在Chart.js中的建议,修改他的回答的源代码以隐藏图形底部的标签。只有几行代码,但是您将丢失导入此Chart.js文件的所有图表的标签,将来升级您的Chart.js版本将变得一团糟。
#2:更好但更难
正如@potatopeelings中的这个答案所解释的那样,您可以重写显示工具提示的函数。因此,您可以保留$scope.labels = ["", "", "", "", "", "", ""];东西来隐藏图形底部的标签,然后重写工具提示函数来显示您想要的标题如下:
$scope.options = {
   // ...
   customTooltips: function(tooltip) {
       // My code to display 'January' / 'February' as a title according to the tooltip param
   }
}
PS :如果您尝试使用customTooltips选项,请考虑将您的Chart.js版本升级到最新版本,因为JSFiddle中的旧版本不支持它。
Stack Overflow用户
发布于 2016-04-10 18:32:31
创建一个id称为图例的div
<div id="legend"></div>添加以下代码。在这里,数据是您所发送的绘制图表。
legend(document.getElementById('legend'), data);

function legend(parent, data) {
    parent.className = 'legend';
    var datas = data.hasOwnProperty('datasets') ? data.datasets : data;

    // remove possible children of the parent
    while(parent.hasChildNodes()) {
        parent.removeChild(parent.lastChild);
    }

    datas.forEach(function(d) {
        var title = document.createElement('span');
        title.className = 'title';
        parent.appendChild(title);

        var colorSample = document.createElement('div');
        colorSample.className = 'color-sample';
        colorSample.style.backgroundColor = d.hasOwnProperty('strokeColor') ? d.strokeColor : d.color;
        colorSample.style.borderColor = d.hasOwnProperty('fillColor') ? d.fillColor : d.color;
        title.appendChild(colorSample);

        var text = document.createTextNode(d.label);
        title.appendChild(text);
    });
}https://stackoverflow.com/questions/36506049
复制相似问题
腾讯云开发者

Copyright © 2013 - 2026 Tencent Cloud. All Rights Reserved. 腾讯云 版权所有
深圳市腾讯计算机系统有限公司 ICP备案/许可证号:粤B2-20090059  粤公网安备44030502008569号
腾讯云计算(北京)有限责任公司 京ICP证150476号 | 京ICP备11018762号