
如何使同一列内的方格图表示土壤柱
如何使同一列内的方格图表示土壤柱
提问于 2016-04-07 12:52:27
我试图演示土壤类型(土壤柱)在不同的深度在地面上使用方框样地。然而,由于采样间隔不一致,在样本之间也存在空白。
我的问题如下:
- 有没有可能把盒子里的情节放在同一栏里?也就是说,所有方格图都在一个直线列中。
- 当使用
ggdraw时,是否可以删除x轴标签和刻度?我试图删除它时使用绘图,但再次出现时,我使用ggdraw。
我的代码如下所示:
 SampleID <- c("Rep-1", "Rep-2", "Rep-3", "Rep-4")
 From <- c(0,2,4,9)
 To <- c(1,4,8,10)
 Mid <- (From+To)/2
 ImaginaryVal <- c(1,1,1,1)
 Soiltype <- c("organic", "silt","clay", "sand")
 df <- data.frame(SampleID, From, To, Mid, ImaginaryVal, Soiltype)

 plot <- ggplot(df, aes(x=ImaginaryVal, ymin=From, lower=From,fill=Soiltype,
            middle=`Mid`, upper=To, ymax=To)) +
          geom_boxplot(colour= "black", stat="identity") +                              scale_y_reverse(breaks = seq(0,10,0.5)) + xlab('Soiltype') +                  ylab('Depth (m)') + theme(axis.text.x = element_blank(),                    axis.ticks.x = element_blank())

 ggdraw(switch_axis_position(plot + theme_bw(8), axis = 'x'))
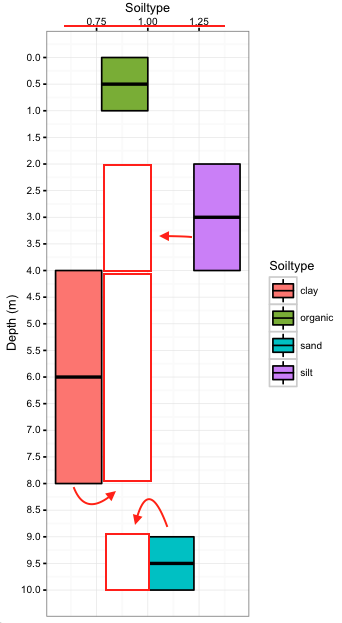
在图中,我用红色的箭头和线条指出了我想要的东西。
回答 1
Stack Overflow用户
回答已采纳
发布于 2016-04-07 13:54:14
您可以这样使用position = position_dodge():
plot <- ggplot(df, aes(x=ImaginaryVal, ymin=From, lower=From,fill=Soiltype, middle=Mid, upper=To, ymax=To)) +
  geom_boxplot(colour= "black", stat="identity", position = position_dodge(width=0)) +
  scale_y_reverse(breaks = seq(0,10,0.5)) +
  xlab('Soiltype') +
  ylab('Depth (m)') +
  theme(axis.text.x = element_blank(), axis.ticks.x = element_blank())

编辑:我认为你根本不需要牛仔故事,如果你想让你的情节看起来像这样的话:
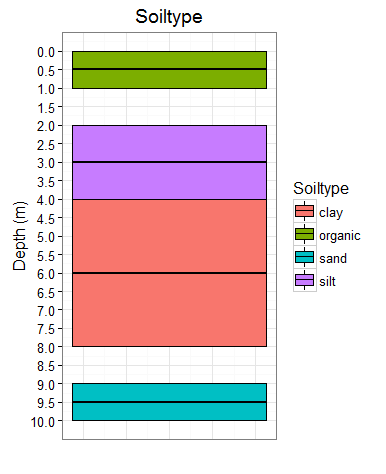
ggplot(df, aes(x=ImaginaryVal, ymin=From, lower=From,fill=Soiltype, middle=Mid, upper=To, ymax=To)) +
  geom_boxplot(colour= "black", stat="identity", position = position_dodge(width=0)) +
  scale_y_reverse(breaks = seq(0,10,0.5)) +
  xlab('Soiltype') +
  ylab('Depth (m)') +
  theme_bw() +
  theme(axis.text.x = element_blank(), axis.ticks.x = element_blank()) +
  xlab("") +
ggtitle("Soiltype")页面原文内容由Stack Overflow提供。腾讯云小微IT领域专用引擎提供翻译支持
原文链接:
https://stackoverflow.com/questions/36476782
复制相关文章
相似问题
腾讯云开发者

Copyright © 2013 - 2026 Tencent Cloud. All Rights Reserved. 腾讯云 版权所有
深圳市腾讯计算机系统有限公司 ICP备案/许可证号:粤B2-20090059 ![]() 粤公网安备44030502008569号
粤公网安备44030502008569号
腾讯云计算(北京)有限责任公司 京ICP证150476号 | 京ICP备11018762号