
如何使用100%闪亮的仪表板高度为R制作传单
如何使用100%闪亮的仪表板高度为R制作传单
提问于 2016-04-07 07:37:54
我正在创建一个闪亮的仪表板应用程序,其中仪表板主体应该显示一些地图。到目前为止,让地图扩展到整个身体的宽度并没有问题,但是它不知怎么不愿意调整到完全的高度。
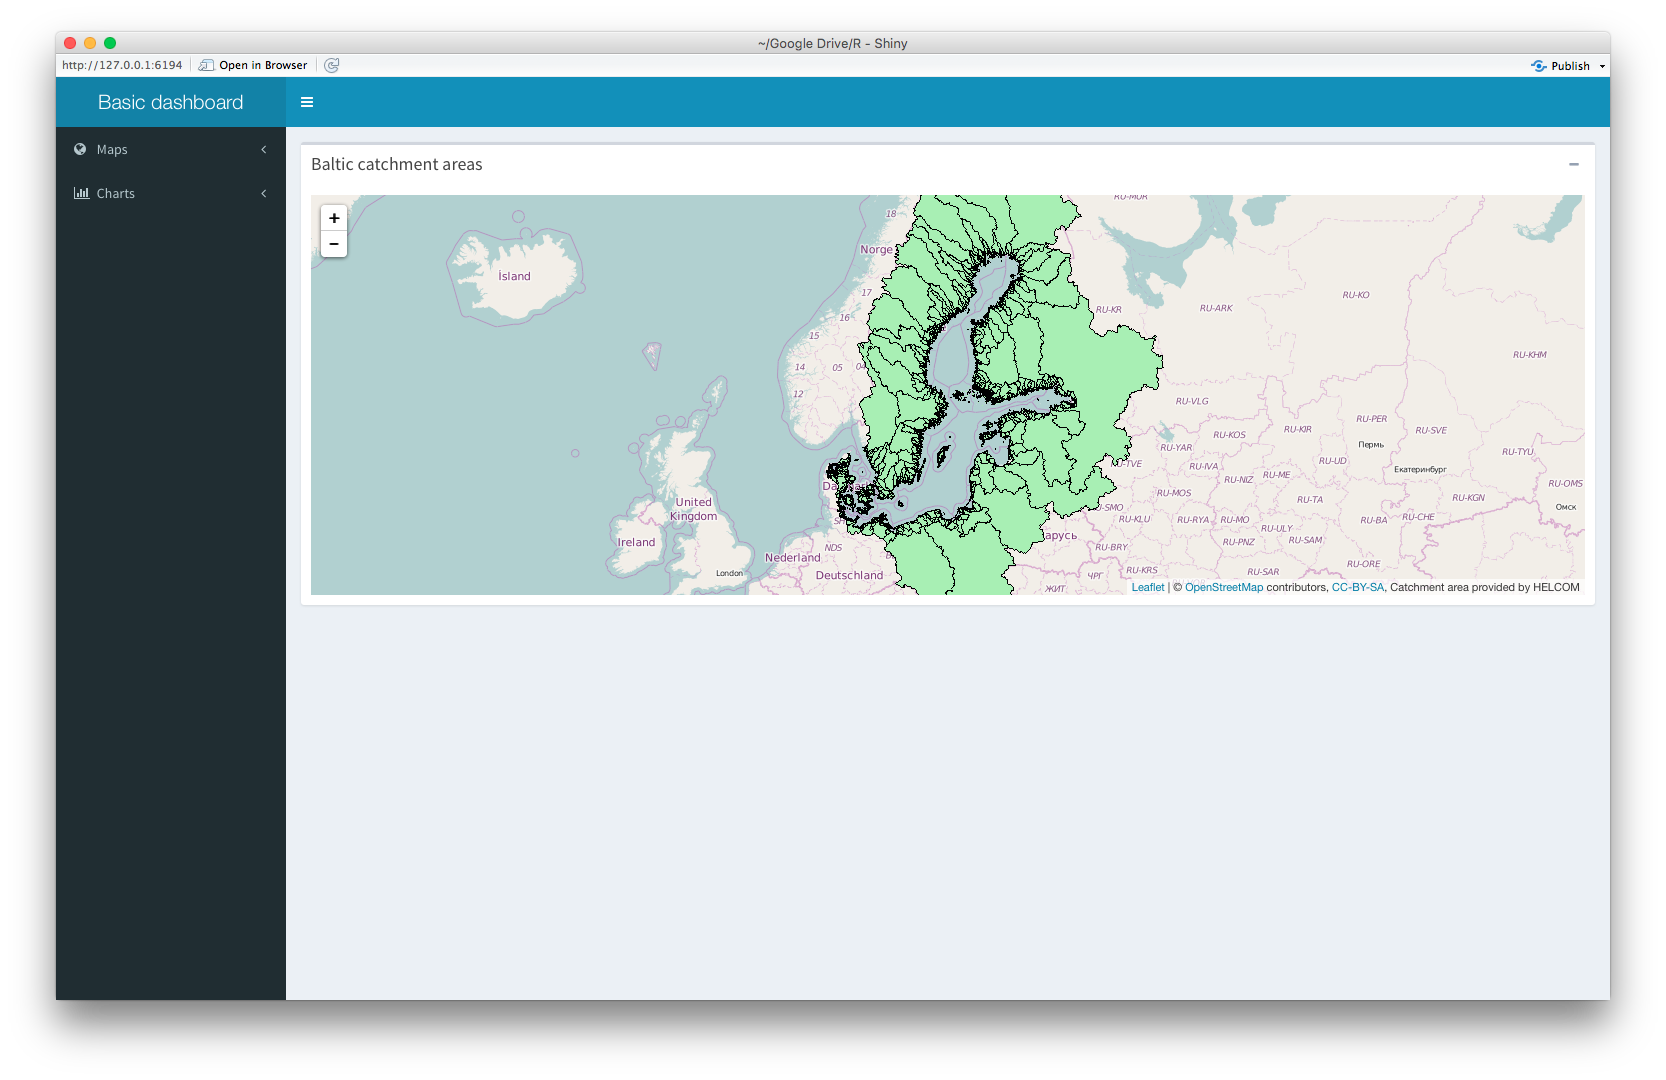
传单本身已经设置为100%的高度,但它做不到这一点。一旦我对leafletOutput使用了with属性,传单对象就会完全不显示,剩下的是一个空框。
该代码可在下面找到:
library(shinydashboard)
library(leaflet)

ui <- dashboardPage(
  dashboardHeader(title = "Basic dashboard"),
  dashboardSidebar(
    sidebarMenu(
      menuItem(
        "Maps",
        tabName = "maps",
        icon = icon("globe"),
        menuSubItem("Watersheds", tabName = "m_water", icon = icon("map")),
        menuSubItem("Population", tabName = "m_pop", icon = icon("map"))
      ),
      menuItem(
        "Charts",
        tabName = "charts",
        icon = icon("bar-chart"),
        menuSubItem("Watersheds", tabName = "c_water", icon = icon("area-chart")),
        menuSubItem("Population", tabName = "c_pop", icon = icon("area-chart"))
      )
    )
  ),
  dashboardBody(
    tabItems(
      tabItem(
        tabName = "m_water",
        box(
          title = "Baltic catchment areas",
          collapsible = TRUE,
          width = "100%",
          height = "100%",
          leafletOutput("l_watershed")
        )
      ),
      tabItem(
        tabName = "m_pop",
        # Map in Dashboard
        leafletOutput("l_population")
      ),
      tabItem(
        tabName = "charts",
        h2("Second tab content")
      )
    )
  )
)

server <- function(input, output) {
  set.seed(122)
  histdata <- rnorm(500)

  output$l_watershed <- renderLeaflet({
    leaflet(height = "100%") %>% addTiles() %>% setView(19.08, 60.25, zoom = 4) %>%addWMSTiles(
      "http://62.236.121.188/arcgis/services/DataAndMaps/Background/MapServer/WMSServer?",
      layers = "11",
      options = WMSTileOptions(
        format = "image/png",
        transparent = TRUE
      ),
      attribution = "Catchment area provided by HELCOM"
    )
  })

  output$l_population <- renderLeaflet({
    leaflet(height = "100%") %>% addTiles() %>% setView(19.08, 60.25, zoom = 4) %>%addWMSTiles(
      "http://62.236.121.188/arcgis/services/DataAndMaps/Background/MapServer/WMSServer?",
      layers = "17",
      options = WMSTileOptions(
        format = "image/png",
        transparent = TRUE
      ),
      attribution = "Population data provided by HELCOM"
    )
  })
}

shinyApp(ui, server)回答 7
Stack Overflow用户
回答已采纳
发布于 2016-04-07 09:18:06
我个人发现,设置相对于窗口大小的高度是更令人满意的.高度作为百分比不起作用,因为dashboardBody具有未定义的高度。但相对于整个文件来说是可以的。
100%的dashoboardBody使100 of (ccs3单位)减去标头(最小50 of)减去dashboardBody填充(2* 15 of)。
因此,将高度设置为100 be 80 be,您应该会没事的。
由于like不支持css3 3单元,因此必须将其直接包含到文档中,如下面的代码所示。
library(shiny)
library(shinydashboard)
library(leaflet)

ui <- dashboardPage(
  dashboardHeader(),
  dashboardSidebar(),
  dashboardBody(
    tags$style(type = "text/css", "#map {height: calc(100vh - 80px) !important;}"),
    leafletOutput("map")
  )
)

server <- function(input, output) {
  output$map <- renderLeaflet({
    leaflet() %>% addTiles() %>% setView(42, 16, 4)
  })
}

runApp(shinyApp(ui, server), launch.browser = TRUE)
玩得开心!
Stack Overflow用户
发布于 2017-11-09 10:19:25
Stack Overflow用户
发布于 2016-04-07 08:47:44
尝试手动添加像素大小:
...
  dashboardBody(
    tabItems(
      tabItem(
        tabName = "m_water",
        box(
          title = "Baltic catchment areas",
          collapsible = TRUE,
          width = "100%",
          height = "1000px",
          leafletOutput("l_watershed",width="100%",height="1000px")
        )
      ),
      tabItem(
        tabName = "m_pop",
        # Map in Dashboard
        leafletOutput("l_population",width="100%",height="1000px")
      ),
      tabItem(
        tabName = "charts",
        h2("Second tab content")
      )
    )
  )
...页面原文内容由Stack Overflow提供。腾讯云小微IT领域专用引擎提供翻译支持
原文链接:
https://stackoverflow.com/questions/36469631
复制相关文章
相似问题
腾讯云开发者

Copyright © 2013 - 2026 Tencent Cloud. All Rights Reserved. 腾讯云 版权所有
深圳市腾讯计算机系统有限公司 ICP备案/许可证号:粤B2-20090059 ![]() 粤公网安备44030502008569号
粤公网安备44030502008569号
腾讯云计算(北京)有限责任公司 京ICP证150476号 | 京ICP备11018762号