
cbind 1:同ID变量值到原始data.frame的数行
我有一个大型的dataframe,其中变量id (第一列)在第二列中以不同的值递归。我的想法是对dataframe进行排序,将其拆分为一个列表,然后应用一个函数将序列1:nrow(变量id)绑定到每个组。到目前为止我的代码是:
DF <- DF[order(DF[,1]),]
DF <- split(DF,DF[,1])
DF <- lapply(1:length(DF), function(i) cbind(DF[[i]], 1:length(DF[[i]])))
但是这给了我一个错误:参数意味着不同的行数。
你能详细说明一下吗?
> head(DF, n=50)
   cell     area
1     1 121.2130
2     2  81.3555
3     3  81.5862
4     4  83.6345
...
33    1 121.3270
34    2  80.7832
35    3  81.1816
36    4  83.3340

DF <- DF[order(DF$cell),]
我想要的是:
> head(DF, n=50)
     cell    area counter
1       1 121.213 1
33      1 121.327 2
65      1 122.171 3
97      1 122.913 4
129     1 123.697 5
161     1 124.474 6
...and等。
这是我的密码:
cell.areas.t <- function(file) {

    dat = paste(file)

    DF <- read.table(dat, col.names = c("cell","area"))
    DF <- splitstackshape::getanID(DF, "cell")[]  # thanks to akrun's answer


    ggplot2::ggplot(data = DF, aes(x = .id , y = area, color = cell)) +
        geom_line(aes(group = cell)) + geom_point(size=0.1)
}
情节是这样的:
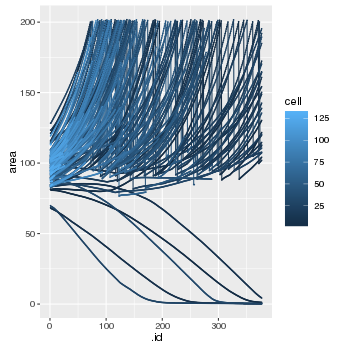
大部分细胞面积增加,只有部分细胞减少。这只是第一次尝试可视化我的数据,所以你不能很好地看到,由于细胞分裂,这些区域会周期性地下降。
附加问题:
有一个问题我事先没有考虑到,那就是在细胞分裂之后,一个新的单元被添加到data.frame中,并被传递给初始的索引1(从图像中可以看到所有单元从.id=1开始,而不是以后),这不是我想要的--它需要继承它创建时间的索引。我首先想到的是,我可以使用一种解析机制来完成新添加的单元变量的这项工作:
DF$.id[DF$cell != temporary.cellindex] <- max(DF$.id[DF$cell != temporary.cellindex]) 你有更好的主意吗?谢谢。
有一个边界条件可以缓解这个问题:在开始(32)处有固定数量的单元格。另一种解决方案是在创建最后一个子单元之前切断所有数据。
更新:附加问题解决了,下面是代码:
cell.areas.t <- function(file) {
    dat = paste(file)
    DF <- read.table(dat, col.names = c("cell","area"))
    DF$.id <- c(0, cumsum(diff(DF$cell) < 0)) + 1L # Indexing

    title <- getwd()

    myplot <- ggplot2::ggplot(data = DF, aes(x = .id , y = area, color = factor(cell))) +
        geom_line(aes(group = cell)) + geom_line(size=0.1) + theme(legend.position="none") + ggtitle(title)

    #save the plot
    image=myplot
    ggsave(file="cell_areas_time.svg", plot=image, width=10, height=8)

}回答 2
Stack Overflow用户
发布于 2016-03-19 20:25:34
我们可以使用来自getanID的splitstackshape
library(splitstackshape)
getanID(DF, "cell")[]Stack Overflow用户
发布于 2016-03-19 20:23:52
有一个更简单的方法来完成这个目标。将ave与seq.int结合使用
DF$group_seq <- ave(DF, DF[,1], FUN=function(x){ seq.int(nrow(x)) } )https://stackoverflow.com/questions/36106616
复制相似问题
腾讯云开发者

Copyright © 2013 - 2026 Tencent Cloud. All Rights Reserved. 腾讯云 版权所有
深圳市腾讯计算机系统有限公司 ICP备案/许可证号:粤B2-20090059 ![]() 粤公网安备44030502008569号
粤公网安备44030502008569号
腾讯云计算(北京)有限责任公司 京ICP证150476号 | 京ICP备11018762号