
在正射投影绘制世界地图时裁剪多边形
在正射投影绘制世界地图时裁剪多边形
提问于 2016-03-10 08:44:39
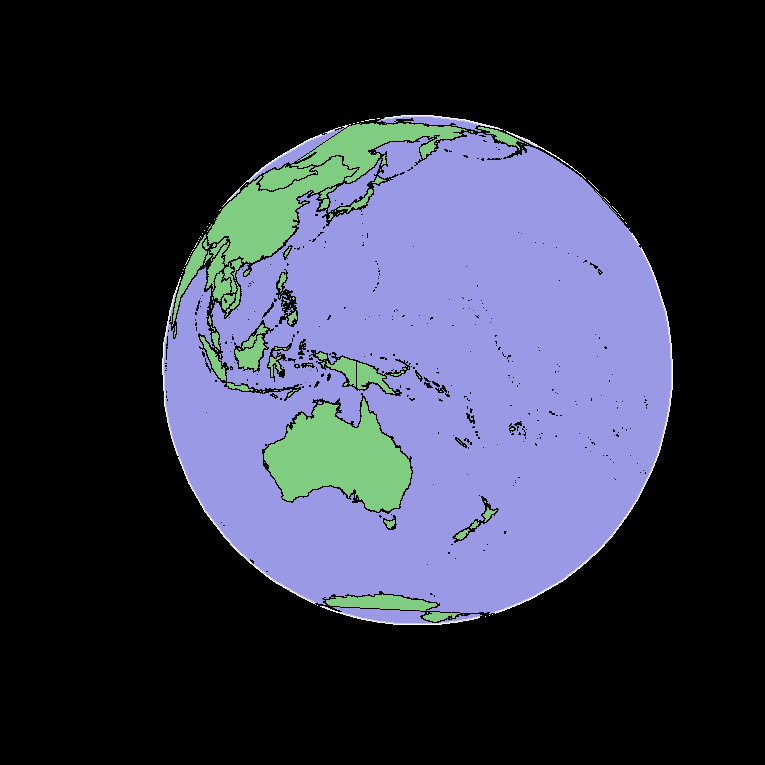
我试着用here修改的代码在R中绘制世界地图,如下所示。产出数字也显示了--很明显,边界附近的陆地区域被剪短了,在这种情况下,俄罗斯和南极洲。我相信这是由于多边形上的一些点缠绕到可见边的“背面”,这些点被映射函数转换为NAs。有什么办法可以绕过这件事吗?
我真的需要那些缺失的区域,因为我的最终目标是绘制这些地图中的几幅,每一幅都有一个稍微不同的中心点。如果某块陆地能随意进出,那就太奇怪了。
library(maps)
library(mapdata)

## start plot & extract coordinates from orthographic map
o <- c(-5,155,0) #orientation
xy <- map("world",proj="orthographic",orientation=o)
## draw a circle around the points for coloring the ocean
polygon(sin(seq(0,2*pi,length.out=100)),cos(seq(0,2*pi,length.out=100)),col=rgb(0.6,0.6,0.9),border=rgb(1,1,1,0.5),lwd=2)
## overlay world map
map("worldHires",proj="orthographic",orientation=o,fill=TRUE,col=rgb(0.5,0.8,0.5),resolution=0,add=TRUE)
回答 1
Stack Overflow用户
回答已采纳
发布于 2016-03-12 23:19:43
我解决了这个问题,我把那些在地球外完全看不见的点投影出来,并将可见的多边形与这些“输出”点一起填充。然后用一个黑色多边形来覆盖溢出的陆地。
为了做到这一点,我使用以下函数(从地图包中修改)检索了毗连的陆地群的坐标:
#Get contiguous country coordinates
contigcoord <- function (database = "world", regions = ".", exact = FALSE, boundary = TRUE, interior = TRUE, fill = FALSE, xlim = NULL, ylim = NULL){
    if (is.character(database))
        as.polygon = fill
    else as.polygon = TRUE
    coord <- maps:::map.poly(database, regions, exact, xlim, ylim, boundary,
        interior, fill, as.polygon)
    return(coord)
}
我还写了投影函数。“前沿”=1,如果点应该是可见的:
#Lat/Long to x-y (0,1 range) in orthographic projection. Cen is the centre point of map
mapproj <- function(lat,long,cenlat,cenlong){
    d2r=pi/180; lat=lat*d2r; long=long*d2r; cenlat=cenlat*d2r; cenlong=cenlong*d2r
    x=cos(lat)*sin(long-cenlong)
    y=cos(cenlat)*sin(lat)-sin(cenlat)*cos(lat)*cos(long-cenlong)
    front=sin(cenlat)*sin(lat)+cos(cenlat)*cos(lat)*cos(long-cenlong) > 0
    return(list(x=x,y=y,front=front))
}
用于填充陆地的代码如下(cenlat和cenlong是可见地球中心的坐标):
xy <- contigcoord("world",fill=TRUE)
coord <- cbind(xy$x,xy$y)
coordtr <- mapproj(coord[,2],coord[,1],cenlat,cenlong)
coord <- cbind(coord,coordtr$x,coordtr$y,coordtr$front)
naloc <- (1:nrow(coord))[!complete.cases(coord)]
naloc <- c(0,naloc)
for(i in 2:length(naloc)){
thispoly <- coord[(naloc[i-1]+1):(naloc[i]-1),3:5,drop=F]
thispoly <- rbind(thispoly,thispoly[1,])
unq <- unique(thispoly[,3])
if(length(unq) == 1){
if(unq == 1){ #Polygon is fully on front side
polygon(thispoly[,1],thispoly[,2],col=rgb(0.5,0.8,0.5),border=NA)
}
} else { #front and back present
ind <- thispoly[,3] == 0
#project points "outside" the globe
temdist <- pmax(sqrt(rowSums(as.matrix(thispoly[ind,1:2]^2))),1e-5)
thispoly[ind,1:2] <- thispoly[ind,1:2]*(2-temdist)/temdist
polygon(thispoly[,1],thispoly[,2],col=rgb(0.5,0.8,0.5),border=NA)
}
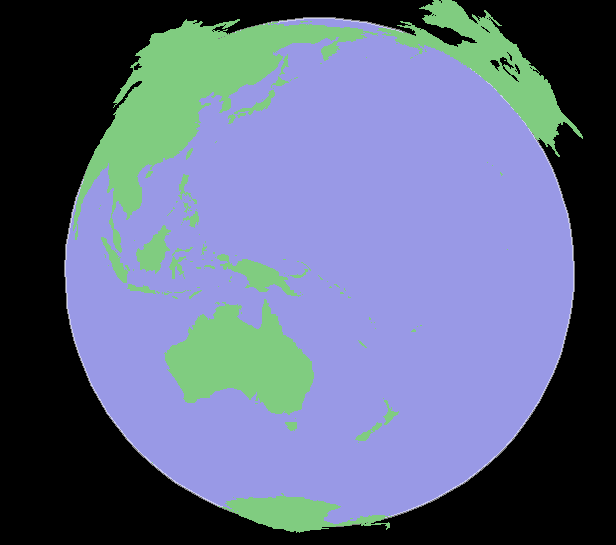
}结果如下所示(在全球范围内应用黑色图层之前):
页面原文内容由Stack Overflow提供。腾讯云小微IT领域专用引擎提供翻译支持
原文链接:
https://stackoverflow.com/questions/35911452
复制相关文章
相似问题
腾讯云开发者

Copyright © 2013 - 2026 Tencent Cloud. All Rights Reserved. 腾讯云 版权所有
深圳市腾讯计算机系统有限公司 ICP备案/许可证号:粤B2-20090059 ![]() 粤公网安备44030502008569号
粤公网安备44030502008569号
腾讯云计算(北京)有限责任公司 京ICP证150476号 | 京ICP备11018762号