
如何从已发表论文清单中确定作者的合著者
我想看看我是否能想象谁在同行评议的期刊上为某一主题发表文章。为此,我将关键字"Barrett's“输入pubmed并下载了一个大文件,该文件为我提供了两个列,Title和Author
structure(list(Title = structure(c(1L, 4L, 3L, 2L, 5L), .Label = c("A case of Barrett's adenocarcinoma with marked endoscopic morphological changes in Barrett's esophagus over a long follow-up period of 15\xe4\xf3\x8ayears.",
"APE1-mediated DNA damage repair provides survival advantage for esophageal adenocarcinoma cells in response to acidic bile salts.",
"Healthcare Cost of Over-Diagnosis of Low-Grade Dysplasia in Barrett's Esophagus.",
"Radiofrequency ablation coupled with Roux-en-Y gastric bypass: a treatment option for morbidly obese patients with Barrett's esophagus.",
"Risk factors for Barrett's esophagus."), class = "factor"),
    Author = structure(c(3L, 5L, 4L, 2L, 1L), .Label = c("Arora Z, Garber A, Thota PN.",
    "Hong J, Chen Z, Peng D, Zaika A, Revetta F, Washington MK, Belkhiri A, El-Rifai W.",
    "Iwaya Y, Yamazaki T, Watanabe T, Seki A, Ochi Y, Hara E, Arakura N, Tanaka E, Hasebe O.",
    "Lash RH, Deas TM Jr, Wians FH Jr.", "Parikh K, Khaitan L."
    ), class = "factor")), .Names = c("Title", "Author"), row.names = c(NA,
5L), class = "data.frame")
我想数一数一个作者和另一个作者一起发表了多少次。我认为最好的方法是创建一个并发矩阵(稍后我将使用igraph)。
我在理解如何将数据转换成这样的矩阵时遇到了一些问题。我想这将涉及将所有作者作为列名和行名列出,然后遍历Auth数据的每一行,并在矩阵中记录两个名称的共现。有什么快捷的方法吗。我不知道该如何处理这件事。所以我试了一下:
1.Extract all the names into a long list from the Author column
2.Then create colnames from the Author list
3.Then create rownames from the Author list
4.Then somehow iterate through Auth[2] and count the name co-occurrence
...but我被困在第一次提取,我尝试了:
AuthSplit<-strsplit(Auth$Author, ",", fixed=T)
AuthSplit<-as.data.frame(AuthSplit)
但我知道这个错误:
 Error in data.frame(c("Iwaya Y", " Yamazaki T", " Watanabe T", " Seki A",  :
  arguments imply differing number of rows: 9, 2, 3, 8, 20, 5, 1, 11, 4, 23, 6, 15, 16, 7, 12, 10, 14, 21, 13, 18, 19, 17, 22
一定有更简单的方法吗?
回答 1
Stack Overflow用户
发布于 2016-03-09 16:43:20
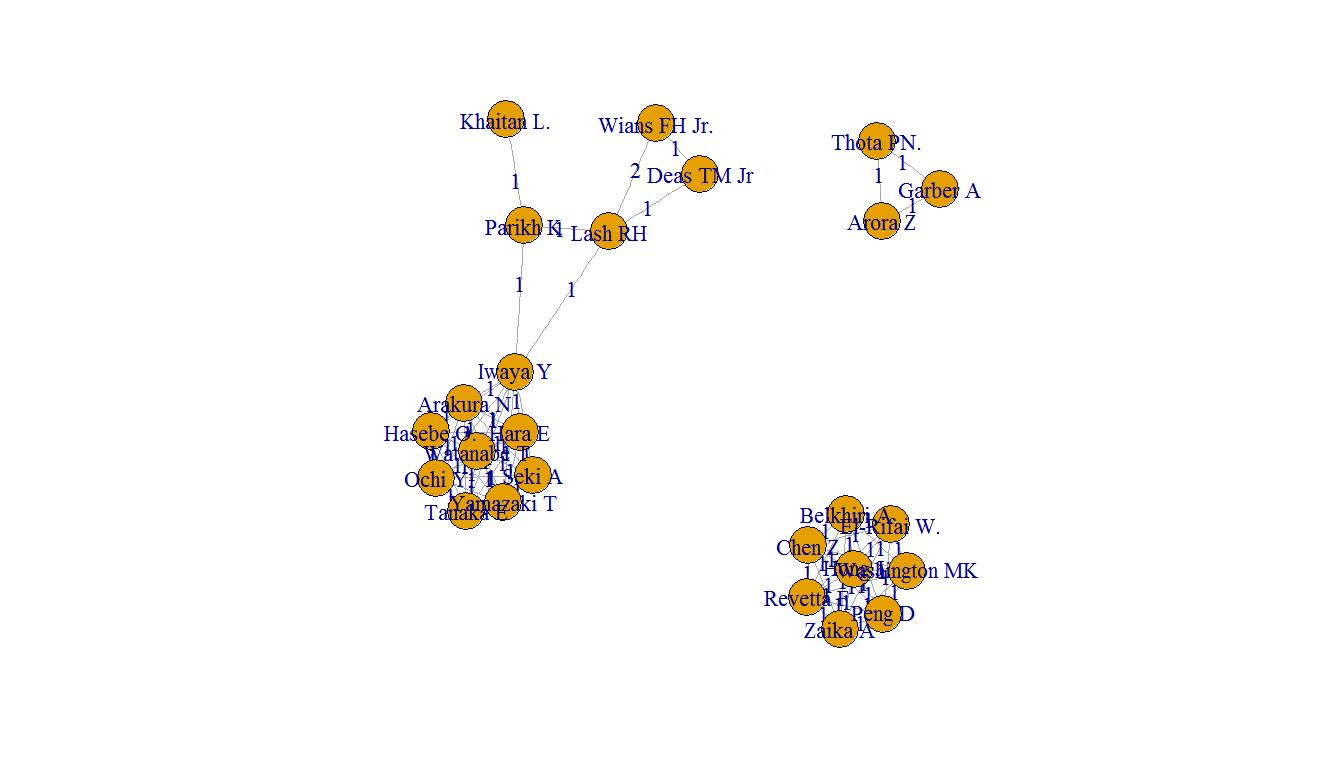
如果有大量作者,则邻接矩阵可能相当大。相反,您可以创建一组作者的列表,igraph可以用来创建一个图。基本的方法是为每一篇论文形成单个作者的向量列表,然后为每一篇论文创建一组作者对的数据框架,只保留第一作者在第二作者之前的字母顺序。然后,将每篇论文的数据帧列表组合成一个更大的数据帧。形成具有独特作者对和每一作者对的论文数量的数据框架。该数据框架用于创建一个图,其中的纸张计数存储在带有边定义的图中。这个计数可以显示在图形的一个图上。
我在您的列表中添加了几篇文章,包括同一作者出现在多篇论文上,而同一对作者是多篇论文的作者的情况。代码看起来就像
library(igraph)
#  add papers with authors from previous papers
  Auth <- rbind(Auth,
              data.frame(Title=c("Paper A","Paper B"),
                         Author=c("Iwaya Y, Parikh K, Lash RH", "Wians FH Jr., Lash RH")))

# create list of individual authors for each paper
  pub_auths <- sapply(Auth$Author, function(x) strsplit(as.character(x), split=","))
  pub_auths <- lapply(pub_auths, trimws)
# for each paper, form a data frame of unique author pairs
  auth_pairs <- lapply(pub_auths, function(x) { z  <-  expand.grid(x, x, stringsAsFactors=FALSE);
                                        z[z$Var1 < z$Var2,]   })
# combine list of matrices for each paper into one data frame
  auth_pairs <- do.call(rbind, auth_pairs)
# count papers for each author pair
  auth_count <- aggregate( paste(Var1, Var2)  ~ Var1 + Var2 , data=auth_pairs, length)
  colnames(auth_count) <- c("Author1","Author2","Paper_count")
# create graph from author pairs
  g <- graph_from_data_frame(auth_count, directed=FALSE)
# plot graph
plot(g, edge.label=E(g)$Paper_count, edge.label.cex=1.4, vertex.label.cex=1.4)在图中,纸张计数显示为边的标签。请注意,Wians和Lash有两篇论文,其中包括添加到数据中的论文。
https://stackoverflow.com/questions/35875857
复制相似问题
腾讯云开发者

Copyright © 2013 - 2026 Tencent Cloud. All Rights Reserved. 腾讯云 版权所有
深圳市腾讯计算机系统有限公司 ICP备案/许可证号:粤B2-20090059 ![]() 粤公网安备44030502008569号
粤公网安备44030502008569号
腾讯云计算(北京)有限责任公司 京ICP证150476号 | 京ICP备11018762号