
最近邻图的大网络图
最近邻图的大网络图
提问于 2016-03-03 04:10:20
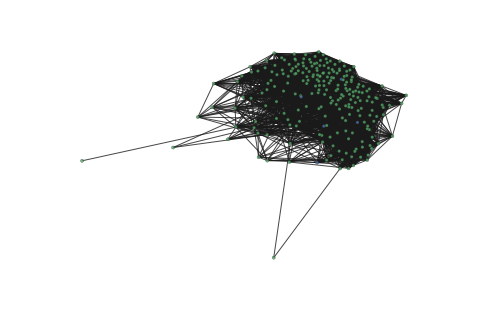
我在努力打造一个网络形象。--它基本上是来自特定节点w/对应颜色的第1和第2邻域的子网络。,我包含了创建第1和第2邻域的函数以及颜色,以及从这些列表创建subgraph的功能。
我认为颜色部分是工作的,但我真的不能说,因为布局是如此小。我尝试过扩展spring_layout(G) w/ 布局,但它似乎不起作用。
,我怎样才能创建一个网络图形,在这里我可以真正地可视化节点及其连接的大小呢?(~ 1000个节点),我本来打算添加with_labels,但为了简单起见,我没有在图像中包括它。
我的主要目标是将根节点"c“(青色)、第一个邻居"b”(蓝色)和第二个邻居"g“(绿色)涂上颜色,使我能够阅读标签并查看连接。
我相信我已经提供了足够的代码,请告诉我,如果我需要添加更多,我会编辑。
import networkx as nx
from collections import defaultdict

def neighborhood(G,node_list):
    #G is the main nx.Graph() object that has ALL the nodes (~7000 nodes)
    D_node_neighborhood = defaultdict(list)
    for node in node_list:
        #Color 1st neighbors blue
        for n1 in G.neighbors(node):
            D_node_neighborhood[node].append((n1,"b"))
            #Color 2nd neighbors green
            for n2 in G.neighbors(n1):
                D_node_neighborhood[node].append((n2,"g"))
    return(D_node_neighborhood)

def subnetwork(G,D_node_neighborhood,root_color = "c"):
    D_node_subgraph = {}
    for node,nghbr_color in D_node_neighborhood.items():
        neighbors = [entry[0] for entry in nghbr_color]
        colors = [entry[1] for entry in nghbr_color]
        H = G.subgraph(neighbors + [node]) #Add root note to neighbors list and create subgraph
        D_node_subgraph[node] = (H,colors + [root_color]) #Do the same with the colors
    return(D_node_subgraph)

D_node_neighborhood.keys()[0] #Grab first one, this object is a list of tuples ("node-name","color-of-node") around 1000
G,colors = D_node_subgraph[node] #Separate them out
nx.draw(G,node_color=colors,node_size=10,alpha=0.8) #Draw the graph w/ corresponding colors
回答 1
Stack Overflow用户
回答已采纳
发布于 2016-03-04 09:23:15
如果我正确理解你的问题,你想要一个更大的数字。
你可以得到图形,并在实际绘图后增加它的大小。
nx.draw(G)
fig = plt.gcf()
fig.set_size_inches((10, 10))
plt.show()为了探索您的图表,我建议使用一个更适合该任务的工具:伤寒。您可以可视化您的网络并连续应用不同的布局,甚至可以手动移动节点。
要从Networkx到Gephi,只需以graphml格式导出图形,如下所示:
nx.write_graphml(G, 'your_graph.graphml')页面原文内容由Stack Overflow提供。腾讯云小微IT领域专用引擎提供翻译支持
原文链接:
https://stackoverflow.com/questions/35763025
复制相关文章
相似问题
腾讯云开发者

Copyright © 2013 - 2026 Tencent Cloud. All Rights Reserved. 腾讯云 版权所有
深圳市腾讯计算机系统有限公司 ICP备案/许可证号:粤B2-20090059 ![]() 粤公网安备44030502008569号
粤公网安备44030502008569号
腾讯云计算(北京)有限责任公司 京ICP证150476号 | 京ICP备11018762号