
不加噪声地生成高斯图像
不加噪声地生成高斯图像
提问于 2016-03-01 15:49:17
我想用Matlab生成高斯图像。它有三个圆圈(作为三个类)。每个圆圈的强度都会随高斯分布而变化。因此,图像的直方图将以question的形式乘以高斯分布。然而,我使用的是一幅无噪声图像,加上高斯噪声,使之产生多重高斯分布,这是非常有噪声的。在这个问题中,我正在寻找一种方法来产生合成高斯图像,这不同于我以前的方法(添加噪声)。感谢阅读
回答 1
Stack Overflow用户
回答已采纳
发布于 2016-03-02 10:50:23
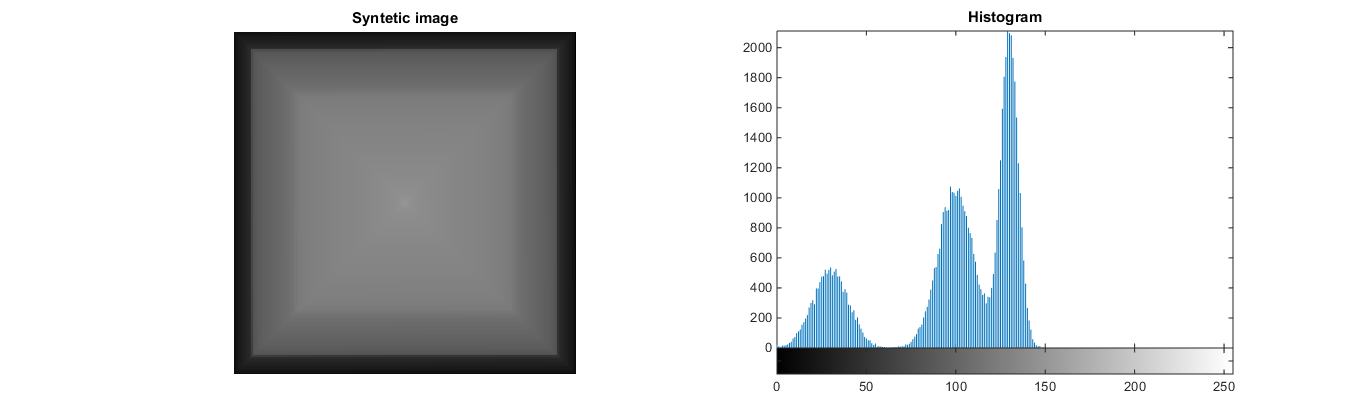
下面的代码通过生成一幅单调递减的平方模式图像,在3高斯(如果需要的话很容易外推到更多的高斯)的混合之后创建一个图像。
它的工作方式是
- 根据期望的分布生成随机数
- 排序说的数字
- 从图像中心向外旋转,并逐像素插入排序值。
代码:
rows=256; columns=256;
grayImage=zeros(rows,columns);

% We will work with doubles in the range of 0-255, and then we will
% discretize, for the shake of dealing properly with random numbers

%define gaussians
mean1=30;   std1=10;
mean2=100;  std2=10;
mean3=130;  std3=5;

% how many points on each of them??
% equal:
n=ceil(rows*columns/3);
% Random samples I tested to make it look as your image
n1=ceil(rows*columns/5);
n2=ceil(2/5*rows*columns);
n3=ceil(2/5*rows*columns);
%generate random numbers
rnd1=normrnd(mean1,std1,n1,1);
rnd2=normrnd(mean2,std2,n2,1);
rnd3=normrnd(mean3,std3,n3,1);

%now the hard part.


rnd=[rnd1;rnd2;rnd3];
% Does this looks like what you want? Tune above parameters if it doesnt.
% histogram(rnd)

% Sort the data
rnd=sort(rnd,'descend');


% Here comes the tricky part: filling the image. I chose square shaped, and
% I fill it in a spiral, starting from the center
% web('https://stackoverflow.com/questions/398299/looping-in-a-spiral')
x= 0;
y= 0;
dx = 0;
dy = -1;
next=1;
for ii= 1:rows*columns
    if (-rows/2 < x <= rows/2) && (-columns/2 < y <= columns/2)
        grayImage(x+columns/2,y+rows/2)=rnd(next);
        next=next+1;
    end
    if x == y || (x < 0 && x == -y) || (x > 0 && x == 1-y)
        auxdx=dx;
        dx=-dy;
        dy =auxdx;
    end
    x=x+dx;
    y=y+dy;
end


%
subplot(121);imshow(uint8(grayImage)); title('Syntetic image');
subplot(122);imhist(uint8(grayImage)); title('Histogram');
输出:
请不要犹豫地问我关于代码的任何问题,但是希望它是很清楚的。
页面原文内容由Stack Overflow提供。腾讯云小微IT领域专用引擎提供翻译支持
原文链接:
https://stackoverflow.com/questions/35727328
复制相关文章
相似问题
腾讯云开发者

Copyright © 2013 - 2026 Tencent Cloud. All Rights Reserved. 腾讯云 版权所有
深圳市腾讯计算机系统有限公司 ICP备案/许可证号:粤B2-20090059 ![]() 粤公网安备44030502008569号
粤公网安备44030502008569号
腾讯云计算(北京)有限责任公司 京ICP证150476号 | 京ICP备11018762号