
R软件包ggpmisc:在回归方程中把帽子放在y上
R软件包ggpmisc:在回归方程中把帽子放在y上
提问于 2016-02-23 18:53:38
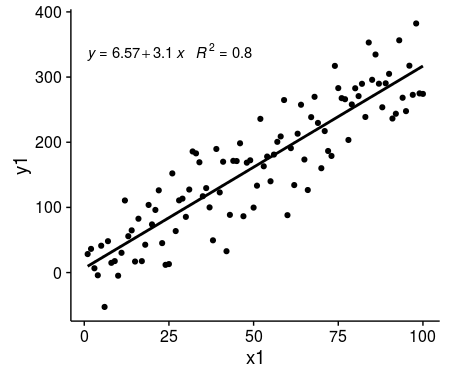
我使用的是R包ggpmisc。想知道如何在回归方程中加入y,或者如何在回归方程中得到自定义响应和解释变量名。
library(ggplot2)
library(ggpmisc)

df <- data.frame(x1 = c(1:100))
set.seed(12345)
df$y1 <- 2 + 3 * df$x1 + rnorm(100, sd = 40)

p <- ggplot(data = df, aes(x = x1, y = y1)) +
  geom_smooth(method = "lm", se=FALSE, color="black", formula = y ~ x) +
  stat_poly_eq(formula = y ~ x,
               aes(label = paste(..eq.label.., ..rr.label.., sep = "~~~")),
               parse = TRUE) +
  geom_point()
p
回答 1
Stack Overflow用户
回答已采纳
发布于 2016-02-23 19:20:47
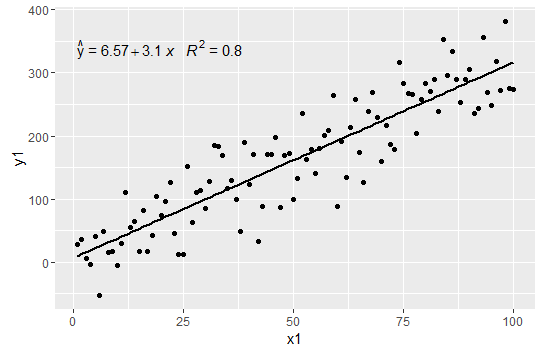
我将关闭粘贴在其中的y的默认值,并构建自己的公式。例如
ggplot(data = df, aes(x = x1, y = y1)) +
  geom_smooth(method = "lm", se=FALSE, color="black", formula = y ~ x) +
  stat_poly_eq(formula = y ~ x, eq.with.lhs=FALSE,
      aes(label = paste("hat(italic(y))","~`=`~",..eq.label..,"~~~", ..rr.label.., sep = "")),
      parse = TRUE) +
geom_point()我们使用eq.with.lhs=FALSE关闭y=的自动包含,然后将hat(y)放在前面(带有等号)。注意,格式来自?plotmath帮助页面。
页面原文内容由Stack Overflow提供。腾讯云小微IT领域专用引擎提供翻译支持
原文链接:
https://stackoverflow.com/questions/35585813
复制相关文章
相似问题
腾讯云开发者

Copyright © 2013 - 2026 Tencent Cloud. All Rights Reserved. 腾讯云 版权所有
深圳市腾讯计算机系统有限公司 ICP备案/许可证号:粤B2-20090059 ![]() 粤公网安备44030502008569号
粤公网安备44030502008569号
腾讯云计算(北京)有限责任公司 京ICP证150476号 | 京ICP备11018762号