
Q图能在实际边缘之外呈现边缘标签吗?
Q图能在实际边缘之外呈现边缘标签吗?
提问于 2016-02-23 11:27:18
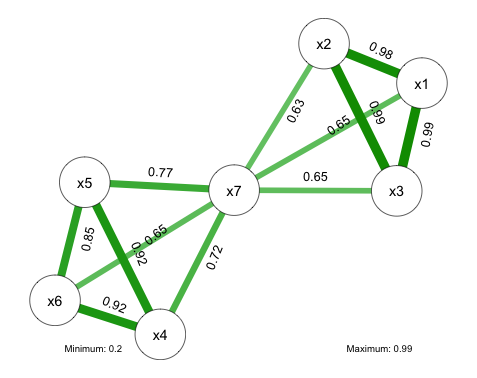
为了提高可读性,我试图将边缘标签插入到实际边缘之外。我特别不喜欢在标签下面加一个白色bg的选项,它会扭曲边缘。根据手册,可以调整边缘标签的位置仅沿线,而不是在侧面。以前有人为这事挣扎过吗?有可能绕过这个问题吗?干杯
回答 1
Stack Overflow用户
回答已采纳
发布于 2016-02-28 18:53:38
似乎没有一个参数来调整边缘标签的横轴位置。一种解决方案是将边缘标签分别添加到绘图中。下面给出了一个例子,给出了下面的图。一般的方法是获取图的布局,然后使用两个节点位置的平均值将文本放置在这条线上。对位置进行手动调整,使文本一般与直线平行,但大多偏离直线(x和y偏移基于角度的正弦和余弦)。如果您想要进一步的控制,您可以手动调整一些text()位置以获得更好的结果。
library(qgraph)

# creating some random data
set.seed(10)
x1 <- rnorm(100,0,1)
x2 <- x1 + rnorm(100,0,0.2)
x3 <- x1 + x2 + rnorm(100,0,0.2)
x4 <- rnorm(100,0,1)
x5 <- x4 + rnorm(100,0,0.4)
x6 <- x4 + rnorm(100,0,0.4)
x7 <- x1 + x5 + rnorm(100,0,0.1)

# making a data frame
df <- cbind(x1,x2,x3,x4,x5,x6,x7)

# calculating the qgraph for the correlation matrix
# a stores the layout
a <- qgraph(cor(df,method="pearson")
           ,layout="spring"
           ,label.cex=0.9
           ,labels=colnames(df)
           ,label.scale=F
           ,details=T
           ,edge.labels=T
           ,doNotPlot=T
           ,alpha=0.05
           ,minimum='sig'
           ,sampleSize=100)

# plotting actual graph
qgraph(cor(df,method="pearson")
       ,layout="spring"
       ,label.cex=0.9
       ,labels=colnames(df)
       ,label.scale=F
       ,details=T
       ,edge.labels=F
       ,doNotPlot=T
       ,alpha=0.05
       ,minimum='sig'
       ,sampleSize=100)

# calculating significance
pvalMat <- Hmisc::rcorr(df,type="pearson")

# loop to add text
for(i in 1:(nrow(a$layout)-1)){
  for(j in (i+1):nrow(a$layout)){

    # is correlation statistically significant
    if(pvalMat$P[i,j] < 0.05){
      # using stored layout values, col1 is x, col2 is y
      loc_center_x <- (a$layout[i,1]+a$layout[j,1])/2
      loc_center_y <- (a$layout[i,2]+a$layout[j,2])/2

      # finding angle of vector
      rotation <- atan((a$layout[i,2]-a$layout[j,2])/(a$layout[i,1]-a$layout[j,1]))*180/pi

      # radial separation
      radius <- 0.1

      # putting text at location
      text(labels=round(cor(df,method="pearson")[i,j],digits=2) # text of correlation with rounded digits
           ,x=loc_center_x + abs(radius*sin(rotation*pi/180))
           ,y=loc_center_y + abs(radius*cos(rotation*pi/180))
           ,srt=rotation
           ,adj=c(0.5,0.5)
           ,cex=0.8)

    }
  }
}页面原文内容由Stack Overflow提供。腾讯云小微IT领域专用引擎提供翻译支持
原文链接:
https://stackoverflow.com/questions/35576319
复制相关文章
相似问题
腾讯云开发者

Copyright © 2013 - 2026 Tencent Cloud. All Rights Reserved. 腾讯云 版权所有
深圳市腾讯计算机系统有限公司 ICP备案/许可证号:粤B2-20090059  粤公网安备44030502008569号
腾讯云计算(北京)有限责任公司 京ICP证150476号 | 京ICP备11018762号