
谷歌图IE11 appendChild不工作
谷歌图IE11 appendChild不工作
提问于 2016-02-11 15:27:19
我使用一个谷歌图散点图来制作下面的图表
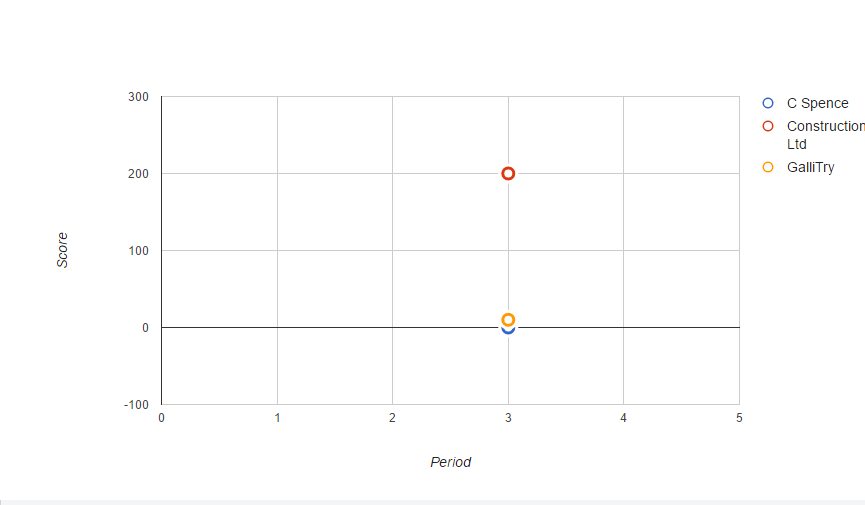
。
这在浏览器中很好,比如Chrome,但是当涉及到IE(V11)时,我得到了下面的错误Unable to get property 'children' of undefined or null reference。这张图仍然很好,但是圆圈是纯色的。
现在我知道这与用于圈样式的代码有关(见下文)
google.visualization.events.addListener(chart, 'ready', function(){
                            $('circle').each(function() {
              var $c = $(this);

              var circles = document.createElementNS("http://www.w3.org/2000/svg", "circle");
              circles.setAttribute("cx",$c.attr('cx'));
              circles.setAttribute("cy",$c.attr('cy'));
              circles.setAttribute("r",$c.attr('r'));
              circles.setAttribute("fill",$c.attr('fill'));
              circles.setAttribute("stroke",'white');
              circles.setAttribute("stroke-width",'3');
              this.parentElement.appendChild(circles);

              circles = document.createElementNS("http://www.w3.org/2000/svg", "circle");
              circles.setAttribute("cx",$c.attr('cx'));
              circles.setAttribute("cy",$c.attr('cy'));
              circles.setAttribute("r", "4");
              circles.setAttribute("fill","white");
              this.parentElement.appendChild(circles);
                            })


}); 我需要一种在IE11+中设计圆圈的方法。我还为图表创建了一个小提琴。
谢谢
回答 1
Stack Overflow用户
回答已采纳
发布于 2016-02-11 16:12:13
您可以使用风格角色来格式化点,而不是手动修改SVG .
google.load('visualization', '1', {'packages': ['corechart'], 'callback': drawChart});

function drawChart() {
  var data = google.visualization.arrayToDataTable([
    ['Age', 'Weight', {type: 'string', role: 'style'}],
    [ 8,     12,       'stroke-color: red;    stroke-width: 3; fill-color: white;'],
    [ 4,     15,       'stroke-color: orange; stroke-width: 3; fill-color: white;'],
    [ 11,    14,       'stroke-color: yellow; stroke-width: 3; fill-color: white;'],
    [ 4,     5,        'stroke-color: green;  stroke-width: 3; fill-color: white;'],
    [ 3,     3.5,      'stroke-color: blue;   stroke-width: 3; fill-color: white;'],
    [ 6.5,   7,        'stroke-color: violet; stroke-width: 3; fill-color: white;']
  ]);

  var options = {
    title: 'Age vs. Weight comparison',
    hAxis: {title: 'Age', minValue: 0, maxValue: 15},
    vAxis: {title: 'Weight', minValue: 0, maxValue: 15},
    legend: 'none',
    pointSize: 10
  };

  var chart = new google.visualization.ScatterChart(document.getElementById('chart_div'));

  chart.draw(data, options);
}<script src="https://www.google.com/jsapi"></script>
<div id="chart_div"></div>
页面原文内容由Stack Overflow提供。腾讯云小微IT领域专用引擎提供翻译支持
原文链接:
https://stackoverflow.com/questions/35343368
复制相关文章
相似问题
腾讯云开发者

Copyright © 2013 - 2026 Tencent Cloud. All Rights Reserved. 腾讯云 版权所有
深圳市腾讯计算机系统有限公司 ICP备案/许可证号:粤B2-20090059 ![]() 粤公网安备44030502008569号
粤公网安备44030502008569号
腾讯云计算(北京)有限责任公司 京ICP证150476号 | 京ICP备11018762号