
将总观测数(n)放在ggplot中的叠加百分比桶图的顶部。
将总观测数(n)放在ggplot中的叠加百分比桶图的顶部。
提问于 2016-01-30 03:02:59
我有一个堆叠的百分比条形图,我想把总观察数放在堆叠栏的顶部(同时保持堆叠的条形图的百分比)。但我总是遇到问题。
下面是生成百分比条形图的代码:
# sample dataset
    set.seed(123)
    cat1<-sample(letters[1:3], 500, replace=T, prob=c(0.1, 0.2, 0.65))
    cat2<-sample(letters[4:8], 500, replace=T, prob=c(0.3, 0.4, 0.75, 0.5, 0.1))
    df <- data.frame(cat1, cat2)

# the barplot
    ggplot(df, aes(x=cat1))+
    geom_bar(aes(fill = cat2),
                    position = 'fill',color = "black")+
    scale_y_continuous(labels = scales::percent)+
    labs ( y = "Percentage")+
      # this final line is me trying to add the label
      geom_text(aes(label=cat1))

# this is the observation number I want display
    table(df$cat1)

    # but I get this error:
Error: geom_text requires the following missing aesthetics: y
所以我有两个问题:
- 如何将每个cat1 "N=“标签的总观察号放在每个堆叠条的顶部)?
- 在我的代码(aes(x=.))中,条形图的y究竟是多少?我有x,但没有y,但情节似乎可行..。
谢谢!
回答 2
Stack Overflow用户
回答已采纳
发布于 2016-01-30 11:52:59
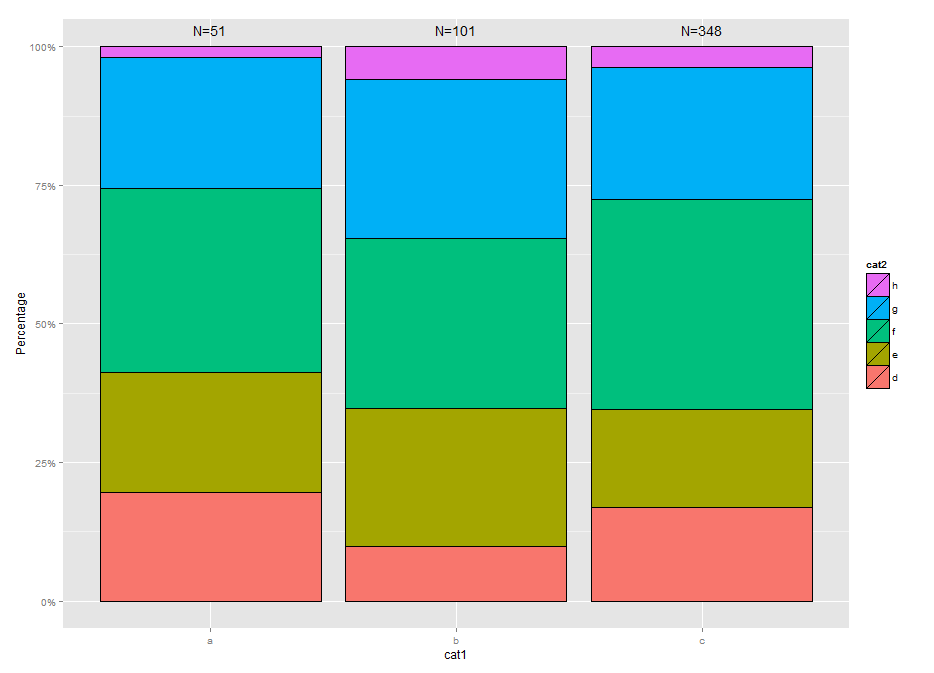
如果您不想硬编码您的摘要标签,这里有一个稍微不同的方法(但仍然有点黑客)使用dplyr来计算您的百分比和格式化您的标签。
我还颠倒了你的传说,以匹配图表上的顺序:)
library(dplyr)

df2 <- df %>%
  group_by(cat1, cat2) %>%
  summarise(n=n())%>%
  mutate(percent = (n / sum(n)), cumsum = cumsum(percent), label=ifelse(cat2=="h", paste0("N=", sum(n)),""))

  ggplot(df2,aes(x=cat1, y=percent, fill=cat2)) +
    scale_y_continuous(labels = scales::percent) +
    labs ( y = "Percentage") +
    geom_bar(position = 'fill',color = "black", stat="identity") +
    geom_text(aes(y=cumsum, label=label), vjust=-1) +
    guides(fill=guide_legend(reverse=T))
Stack Overflow用户
发布于 2016-01-30 11:20:04
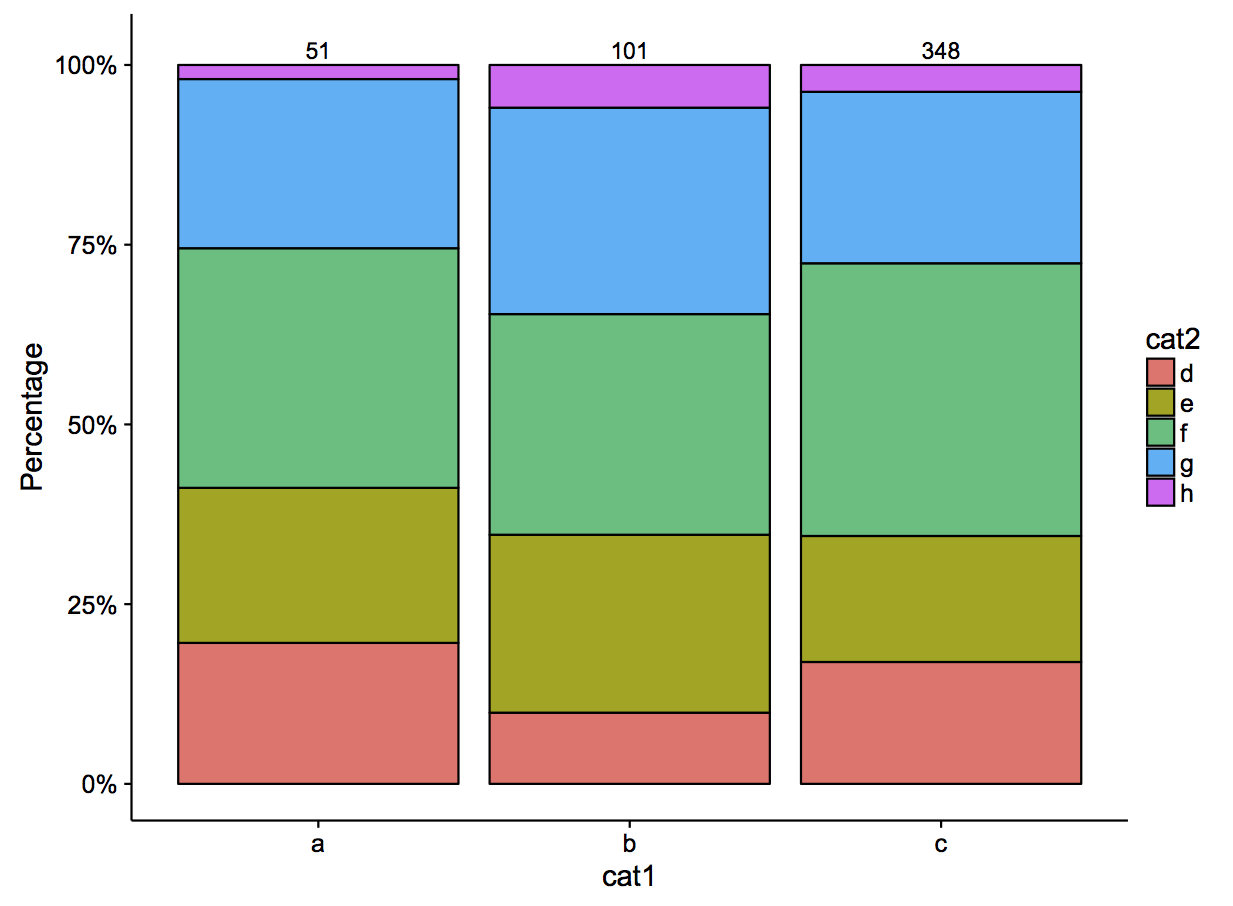
你可以试试
temp <- data.frame(x=c("a", "b", "c"), y=c(1.02, 1.02, 1.02), z=c(51, 101, 348))

   ggplot(df, aes(x=cat1))+
    geom_bar(aes(fill = cat2),
                    position = 'fill',color = "black")+
    scale_y_continuous(labels = scales::percent)+
    labs ( y = "Percentage")+
      # this final line is me trying to add the label
      geom_text(data=temp, aes(x=x, y=y, label=as.factor(z)))
页面原文内容由Stack Overflow提供。腾讯云小微IT领域专用引擎提供翻译支持
原文链接:
https://stackoverflow.com/questions/35097489
复制相关文章
相似问题
腾讯云开发者

Copyright © 2013 - 2026 Tencent Cloud. All Rights Reserved. 腾讯云 版权所有
深圳市腾讯计算机系统有限公司 ICP备案/许可证号:粤B2-20090059 ![]() 粤公网安备44030502008569号
粤公网安备44030502008569号
腾讯云计算(北京)有限责任公司 京ICP证150476号 | 京ICP备11018762号