
geom_histogram中密度最高的垃圾桶的自定义填充颜色
geom_histogram中密度最高的垃圾桶的自定义填充颜色
提问于 2016-01-26 08:53:03
我的示例数据框架如下:
a <- structure(list(Middlepoint = c(1, 2, 3, 4, 5, 6, 7, 8, 9, 1,
12, 13, 14, 15, 16, 17, 18, 19, 1, 1, 5, 5, 4, 4, 3, 7, 18, 8,
8, 8, 8, 8, 8.5, 8.5)), .Names = "Middlepoint", class = "data.frame", row.names = c(NA,
-34L))我想创建一个binwidth = 1直方图,其特征如下:
library(ggplot2)
library(scales)
ggplot(a, aes(x = Middlepoint)) +
geom_histogram(aes(y = ..density.., fill=..density..), binwidth = 1) +
scale_x_continuous(breaks=0:19) +
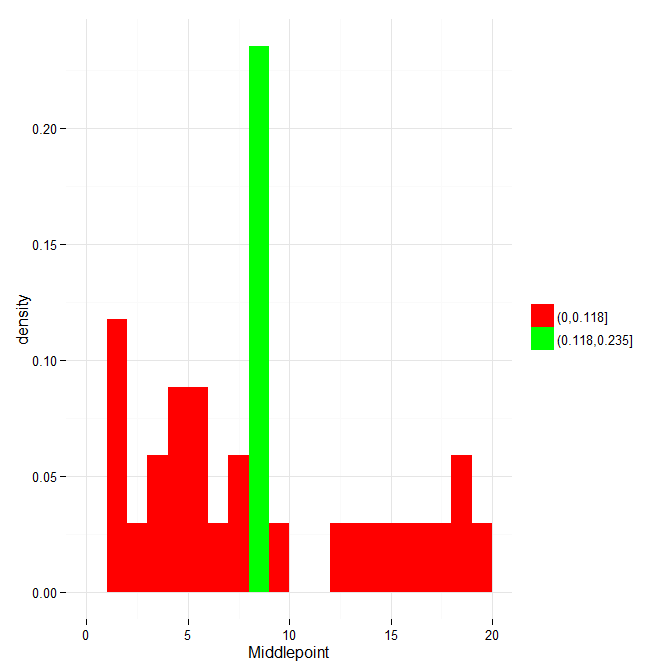
scale_fill_continuous(low = "red", high = "green")现在,我无法搞清楚的是,如何将密度最高的垃圾桶(这里,宾8-9)涂成绿色,以及其他所有的垃圾桶涂上红色(没有渐变,只有直颜色)。
正如您可以从上面的代码中看到的那样,我能得到的最接近的结果是使用scale_fill_continuous()组件,它非常接近,但不是我想要看到的。我尝试过像ggplot change fill colour without losing colour gradient和R - ggplot2 histogram conditional fill color这样的线程。有什么想法,一般如何自定义填充直方图的垃圾箱?
回答 1
Stack Overflow用户
回答已采纳
发布于 2016-01-26 09:21:01
您需要将fill参数设置为一个factor,它需要两个级别:一个用于所有密度值,一个用于低于max的密度值,另一个用于最大密度:
ggplot(a, aes(x = Middlepoint)) +
  geom_histogram(aes(y    = ..density..,
                     fill = cut(..density.., c(0, sort(..density.., TRUE)[1:2]))),
                 binwidth = 1) +
  scale_fill_manual("", values = c("red", "green")) +
  theme_minimal()
页面原文内容由Stack Overflow提供。腾讯云小微IT领域专用引擎提供翻译支持
原文链接:
https://stackoverflow.com/questions/35009971
复制相关文章
相似问题
腾讯云开发者

Copyright © 2013 - 2026 Tencent Cloud. All Rights Reserved. 腾讯云 版权所有
深圳市腾讯计算机系统有限公司 ICP备案/许可证号:粤B2-20090059 ![]() 粤公网安备44030502008569号
粤公网安备44030502008569号
腾讯云计算(北京)有限责任公司 京ICP证150476号 | 京ICP备11018762号