
jqPivot-如何只显示数据行而不是摘要标题?
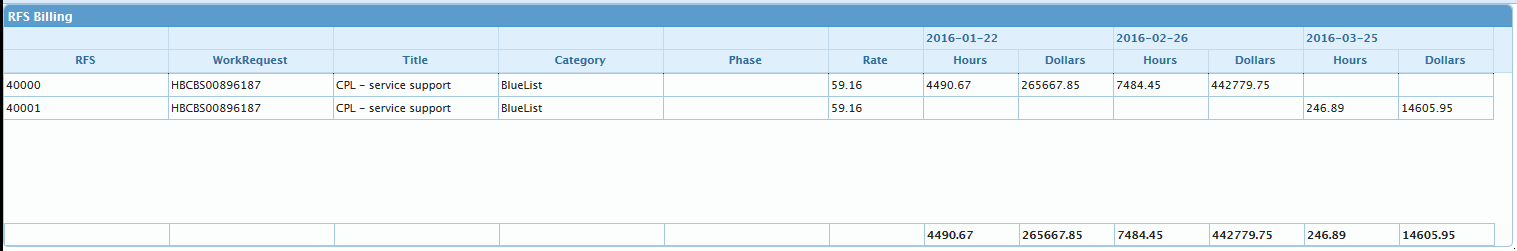
我正在尝试构建一个jqPivot (示例jsFiddle这里:http://jsfiddle.net/reckert/vqetvqoc/1/) --我需要一个行,其中包含每个X维,然后是值--我得到的是
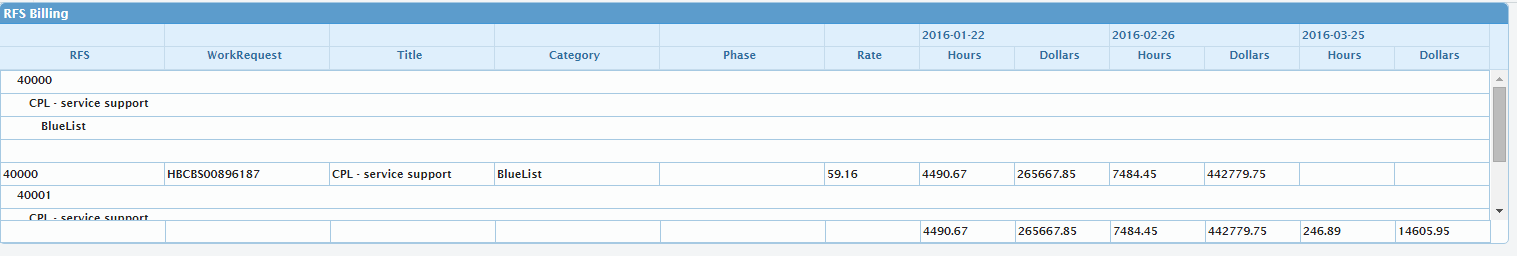
如何删除上折叠的行,以便获得更多的内容:
我已经尝试了trirand jqGrid和free.jqGrid,并得到了类似的结果。下面是我使用的代码:
var mydata = [{
  "System": "Central Product Library (CPL)",
  "RFSTitle": "CPL - service support",
  "WorkRequest": "HBCBS00896187",
  "RFS": "40000",
  "PCR": "1",
  "EstimateType": "IE",
  "PHASE": "New",
  "Estimate": 10000.0,
  "BilledTo": null,
  "Lock": false,
  "CategoryID": 2,
  "Category": "BlueList",
  "Rate": 59.1600,
  "MonthEndDate": "2016-01-22T00:00:00",
  "MonthHours": 3750.000000000000,
  "MonthDollars": 221850.000000
}, {
  "System": "Central Product Library (CPL)",
  "RFSTitle": "CPL - service support",
  "WorkRequest": "HBCBS00896187",
  "RFS": "40000",
  "PCR": "1",
  "EstimateType": "IE",
  "PHASE": "New",
  "Estimate": 10000.0,
  "BilledTo": null,
  "Lock": false,
  "CategoryID": 2,
  "Category": "BlueList",
  "Rate": 59.1600,
  "MonthEndDate": "2016-02-26T00:00:00",
  "MonthHours": 6250.000000000000,
  "MonthDollars": 369750.000000
}, {
  "System": "Central Product Library (CPL)",
  "RFSTitle": "CPL - service support",
  "WorkRequest": "HBCBS00896187",
  "RFS": "40000",
  "PCR": "2",
  "EstimateType": "IE",
  "PHASE": "1",
  "Estimate": 2222.0,
  "BilledTo": null,
  "Lock": false,
  "CategoryID": 2,
  "Category": "BlueList",
  "Rate": 59.1600,
  "MonthEndDate": "2016-01-22T00:00:00",
  "MonthHours": 740.670000000000,
  "MonthDollars": 43817.850000
}, {
  "System": "Central Product Library (CPL)",
  "RFSTitle": "CPL - service support",
  "WorkRequest": "HBCBS00896187",
  "RFS": "40000",
  "PCR": "2",
  "EstimateType": "IE",
  "PHASE": "1",
  "Estimate": 2222.0,
  "BilledTo": null,
  "Lock": false,
  "CategoryID": 2,
  "Category": "BlueList",
  "Rate": 59.1600,
  "MonthEndDate": "2016-02-26T00:00:00",
  "MonthHours": 1234.450000000000,
  "MonthDollars": 73029.750000
}, {
  "System": "Central Product Library (CPL)",
  "RFSTitle": "CPL - service support",
  "WorkRequest": "HBCBS00896187",
  "RFS": "40000",
  "PCR": "2",
  "EstimateType": "IE",
  "PHASE": "1",
  "Estimate": 2222.0,
  "BilledTo": null,
  "Lock": false,
  "CategoryID": 2,
  "Category": "BlueList",
  "Rate": 59.1600,
  "MonthEndDate": "2016-03-25T00:00:00",
  "MonthHours": 246.890000000000,
  "MonthDollars": 14605.950000
}];


var grid = $("#grid");

grid.jqGrid('jqPivot',
  mydata, {
    xDimension: [

      {
        groupfield: false,
        groupSummary: false,
        width: 160,
        dataName: 'RFS',
        label: 'RFS'
      }, {
        isGroupField: false,
        groupSummary: false,
        width: 160,
        dataName: 'WorkRequest',
        label: 'WorkRequest'
      },

      {
        groupfield: false,
        groupSummary: false,
        width: 160,
        dataName: 'RFSTitle',
        label: 'Title'
      }, {
        groupfield: false,
        groupSummary: false,
        width: 160,
        dataName: 'Category',
        label: 'Category'
      }, {
        groupfield: false,
        groupSummary: false,
        width: 160,
        dataName: 'Phase',
        label: 'Phase'
      }, {
        groupfield: false,
        groupSummary: false,
        width: 160,
        dataName: 'Rate',
        label: 'Rate'
      },
    ],
    yDimension: [{
        dataName: 'MonthEndDate'
      }
      //,            { dataName: 'PCR' }
    ],
    aggregates: [{
      aggregator: 'sum',
      width: 160,
      member: 'MonthHours',
      label: "Hours"
    }, {
      aggregator: 'sum',
      width: 160,
      member: 'MonthDollars',
      label: "Dollars"
    }],
    groupSummary: false,
    colTotals: true
  },
  // grid options
  {
    groupingView: {
      hideFirstGroupCol: false,
      groupSummary: [false, false, false, false, false, false],
      groupSummaryPos: ["trailer", "trailer", "trailer", "trailer", "trailer", "trailer"],
    },
    pager: true,
    pager: "#MonthlyBillPivotPager",
    iconSet: "fontAwesome",
    cmTemplate: {
      autoResizable: true
    },
    shrinkToFit: false,
    autoresizeOnLoad: true,
    autoResizing: {
      compact: true
    },
    caption: 'RFS Billing',
    hideFirstGroupCol: false
  }
);回答 1
Stack Overflow用户
发布于 2016-01-26 00:00:50
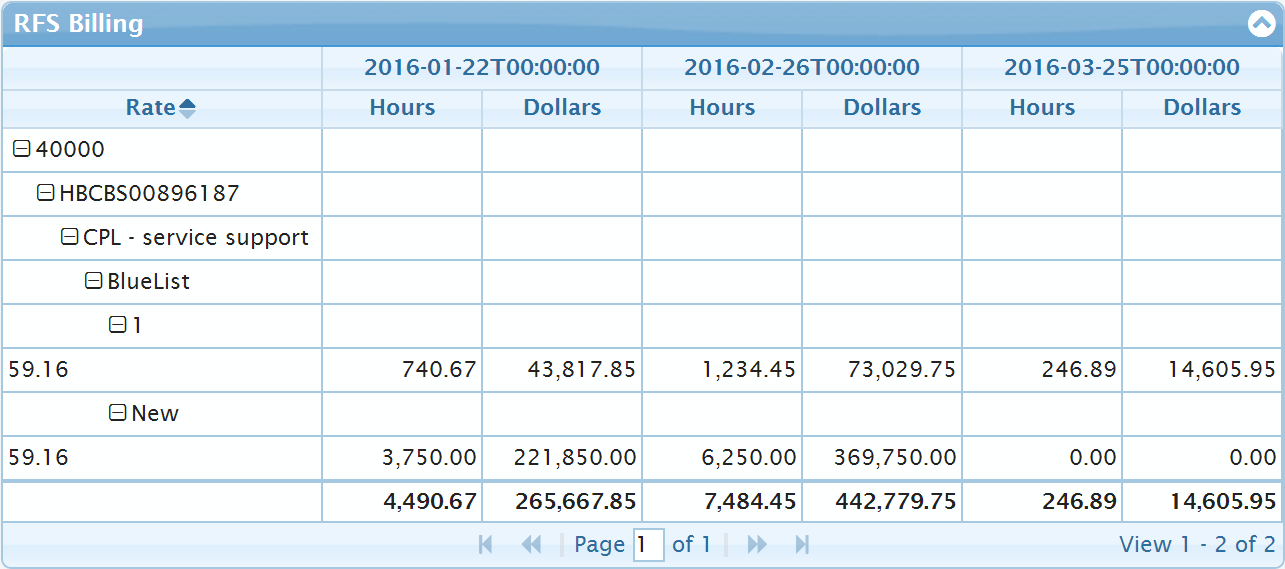
您的代码在某些属性或选项的值的名称中有一些小错误。例如,您使用groupSummaryPos,它包含不存在的值:"trailer",但唯一允许的值是:"header"或"footer"。我只删除了所有不需要的财产。我建议您阅读维基文章,其中描述了在免费jqGrid中使用的jqPivot选项。
主要的问题是数据分组的问题。造成这一问题的原因是使用PHASE属性的名称错误。源数据包含该属性,但您使用了dataName: 'Phase' (错误的情况!!):
{
    groupfield: false,
    groupSummary: false,
    width: 160,
    dataName: 'Phase',
    label: 'Phase'
}要解决这个问题,您应该将xDimension的项更改为
{
    width: 80,
    dataName: 'PHASE',
    label: 'Phase'
}此外,我还删除了autoresizeOnLoad: true,因为它不使用顶级列标题中的文本。
您可以在演示中看到分组的结果:https://jsfiddle.net/OlegKi/tcxv2o22/4/
https://stackoverflow.com/questions/35002312
复制相似问题
腾讯云开发者

Copyright © 2013 - 2026 Tencent Cloud. All Rights Reserved. 腾讯云 版权所有
深圳市腾讯计算机系统有限公司 ICP备案/许可证号:粤B2-20090059 ![]() 粤公网安备44030502008569号
粤公网安备44030502008569号
腾讯云计算(北京)有限责任公司 京ICP证150476号 | 京ICP备11018762号