
np.random.normal的非随机抽样版本
np.random.normal的非随机抽样版本
提问于 2016-01-20 17:19:38
我试图生成一个数组,它遵循精确的高斯分布。np.random.normal是通过从高斯随机抽样来做到这一点的,但是我如何在给定均值和西格玛的情况下再现和精确的高斯。因此,数组将产生一个直方图,它遵循的是精确的高斯,而不仅仅是下面所示的近似高斯。
mu, sigma = 10, 1
s = np.random.normal(mu, sigma, 1000)

fig = figure()
ax = plt.axes()

totaln, bbins, patches = ax.hist(s, 10, normed = 1, histtype = 'stepfilled', linewidth = 1.2)

plt.show()回答 1
Stack Overflow用户
发布于 2016-01-20 17:33:16
如果你想要一个精确的高斯直方图,不要生成点。你永远不可能从观察到的点中得到“精确”的高斯分布,仅仅因为你不能在直方图中得到一个点的分数。
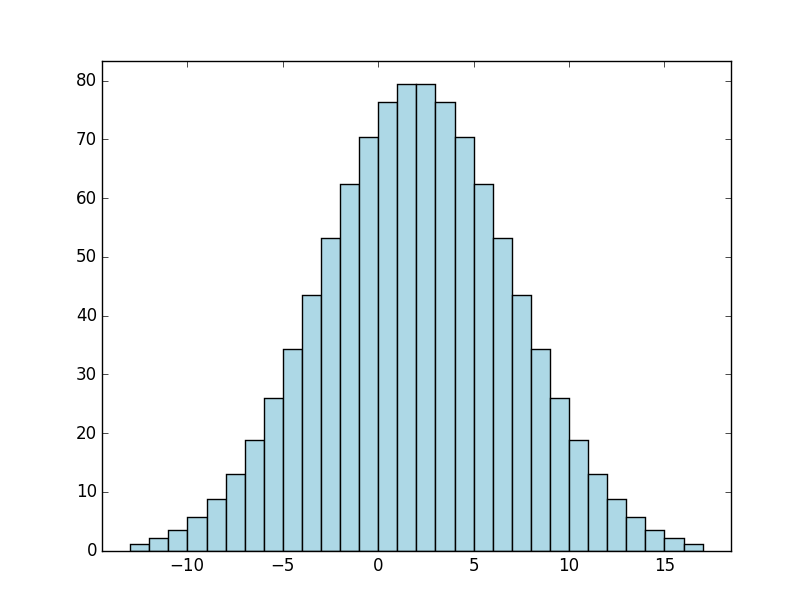
相反,以条形图的形式绘制曲线。
import numpy as np
import matplotlib.pyplot as plt

def gaussian(x, mean, std):
    scale = 1.0 / (std * np.sqrt(2 * np.pi))
    return scale * np.exp(-(x - mean)**2 / (2 * std**2))

mean, std = 2.0, 5.0
nbins = 30
npoints = 1000

x = np.linspace(mean - 3 * std, mean + 3 * std, nbins + 1)
centers = np.vstack([x[:-1], x[1:]]).mean(axis=0)
y = npoints * gaussian(centers, mean, std)

fig, ax = plt.subplots()
ax.bar(x[:-1], y, width=np.diff(x), color='lightblue')

# Optional...
ax.margins(0.05)
ax.set_ylim(bottom=0)

plt.show()
页面原文内容由Stack Overflow提供。腾讯云小微IT领域专用引擎提供翻译支持
原文链接:
https://stackoverflow.com/questions/34906438
复制相关文章
相似问题
腾讯云开发者

Copyright © 2013 - 2026 Tencent Cloud. All Rights Reserved. 腾讯云 版权所有
深圳市腾讯计算机系统有限公司 ICP备案/许可证号:粤B2-20090059 ![]() 粤公网安备44030502008569号
粤公网安备44030502008569号
腾讯云计算(北京)有限责任公司 京ICP证150476号 | 京ICP备11018762号