
如何在ggplot2中分别缩放线和点的大小
如何在ggplot2中分别缩放线和点的大小
提问于 2016-01-20 07:18:38
守则如下:
set.seed(123)
d1=data.frame(x=runif(10),y=runif(10),z=runif(10,1,10))
d2=data.frame(x=runif(10),y=runif(10),z=runif(10,100,1000))
ggplot()+geom_point(aes(x,y,size=z),data=d1)+
geom_line(aes(x,y,size=z),data=d2)
其结果是:
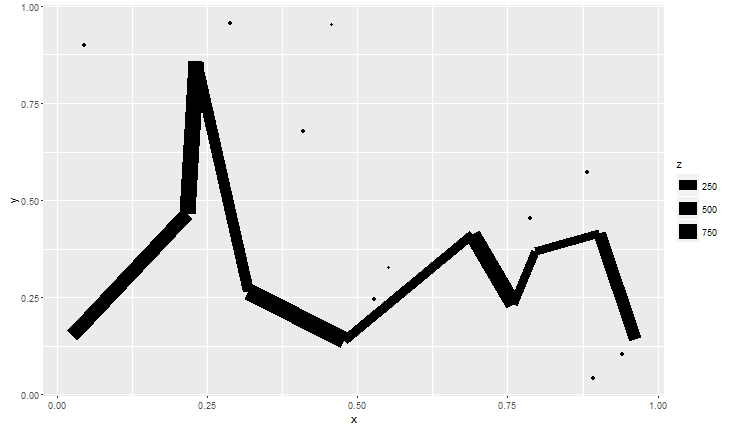
点的大小太小了,所以我想用scale_size来改变它的大小。然而,线和点似乎都受到了影响。所以,我想知道是否有一种方法,分别缩放线和点与一个单独的传奇?
回答 2
Stack Overflow用户
回答已采纳
发布于 2016-02-04 23:22:40
我能想到的两种方式是: 1)结合两个传奇格罗布,或者2)侵入另一种传说美学。在上面的评论中,Mike提到了这两个问题。
方法#1:使用grobs将两个不同的传说组合在同一地块中。
我使用了这个回答的代码来获取图例。巴普蒂斯特的arrangeGrob小体是一个有用的参考。
library(grid); library(gridExtra)
#Function to extract legend grob
g_legend <- function(a.gplot){
tmp <- ggplot_gtable(ggplot_build(a.gplot))
leg <- which(sapply(tmp$grobs, function(x) x$name) == "guide-box")
legend <- tmp$grobs[[leg]]
legend
}
#Create plots
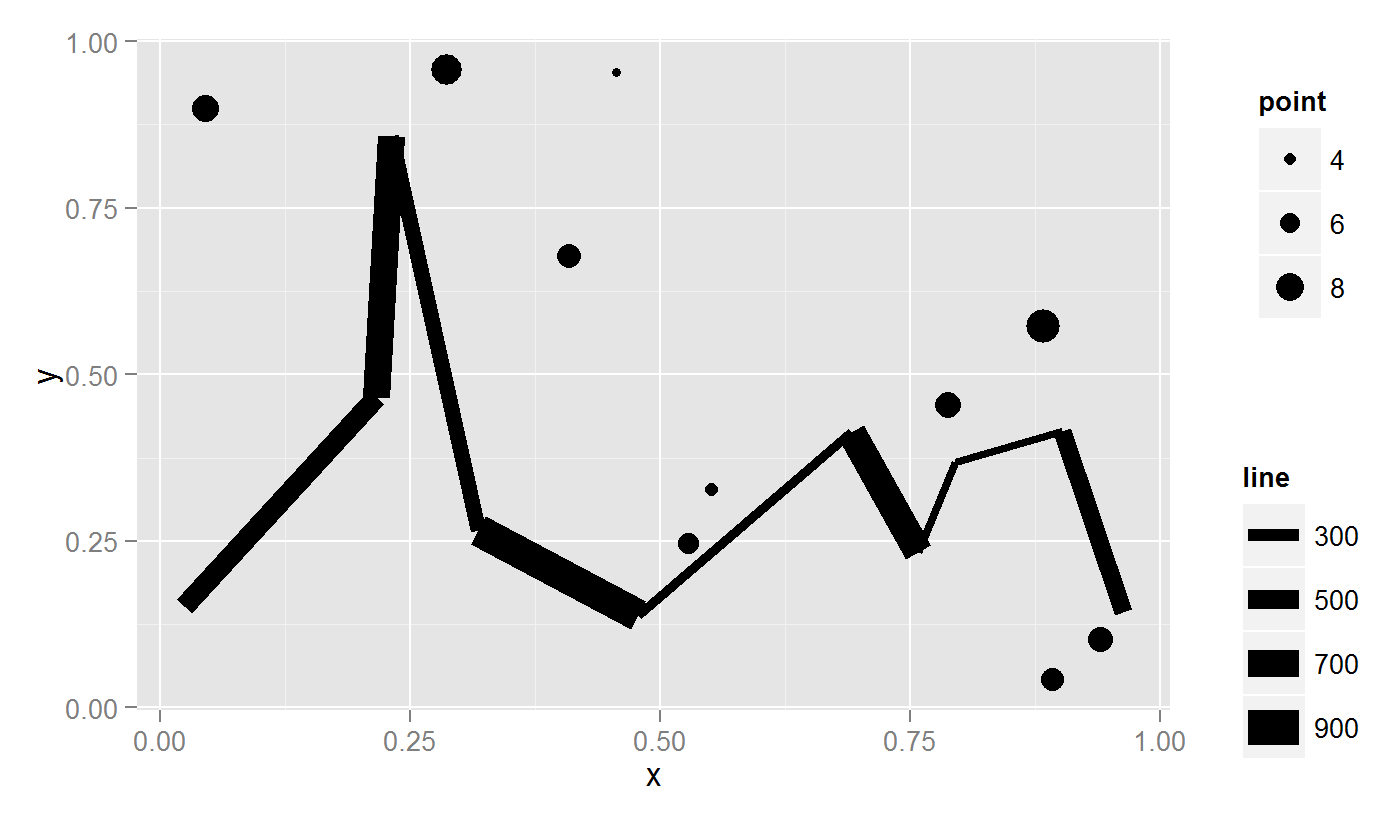
p1 <- ggplot()+ geom_point(aes(x,y,size=z),data=d1) + scale_size(name = "point")
p2 <- ggplot()+ geom_line(aes(x,y,size=z),data=d2) + scale_size(name = "line")
p3 <- ggplot()+ geom_line(aes(x,y,size=z),data=d2) +
geom_point(aes(x,y, size=z * 100),data=d1) # Combined plot
legend1 <- g_legend(p1)
legend2 <- g_legend(p2)
legend.width <- sum(legend2$width)
gplot <- grid.arrange(p3 +theme(legend.position = "none"), legend1, legend2,
ncol = 2, nrow = 2,
layout_matrix = rbind(c(1,2 ),
c(1,3 )),
widths = unit.c(unit(1, "npc") - legend.width, legend.width))
grid.draw(gplot)打印注意:使用arrangeGrob()而不是grid.arrange()。我不得不使用png; grid.draw; dev.off来保存(arrangeGrob)图。
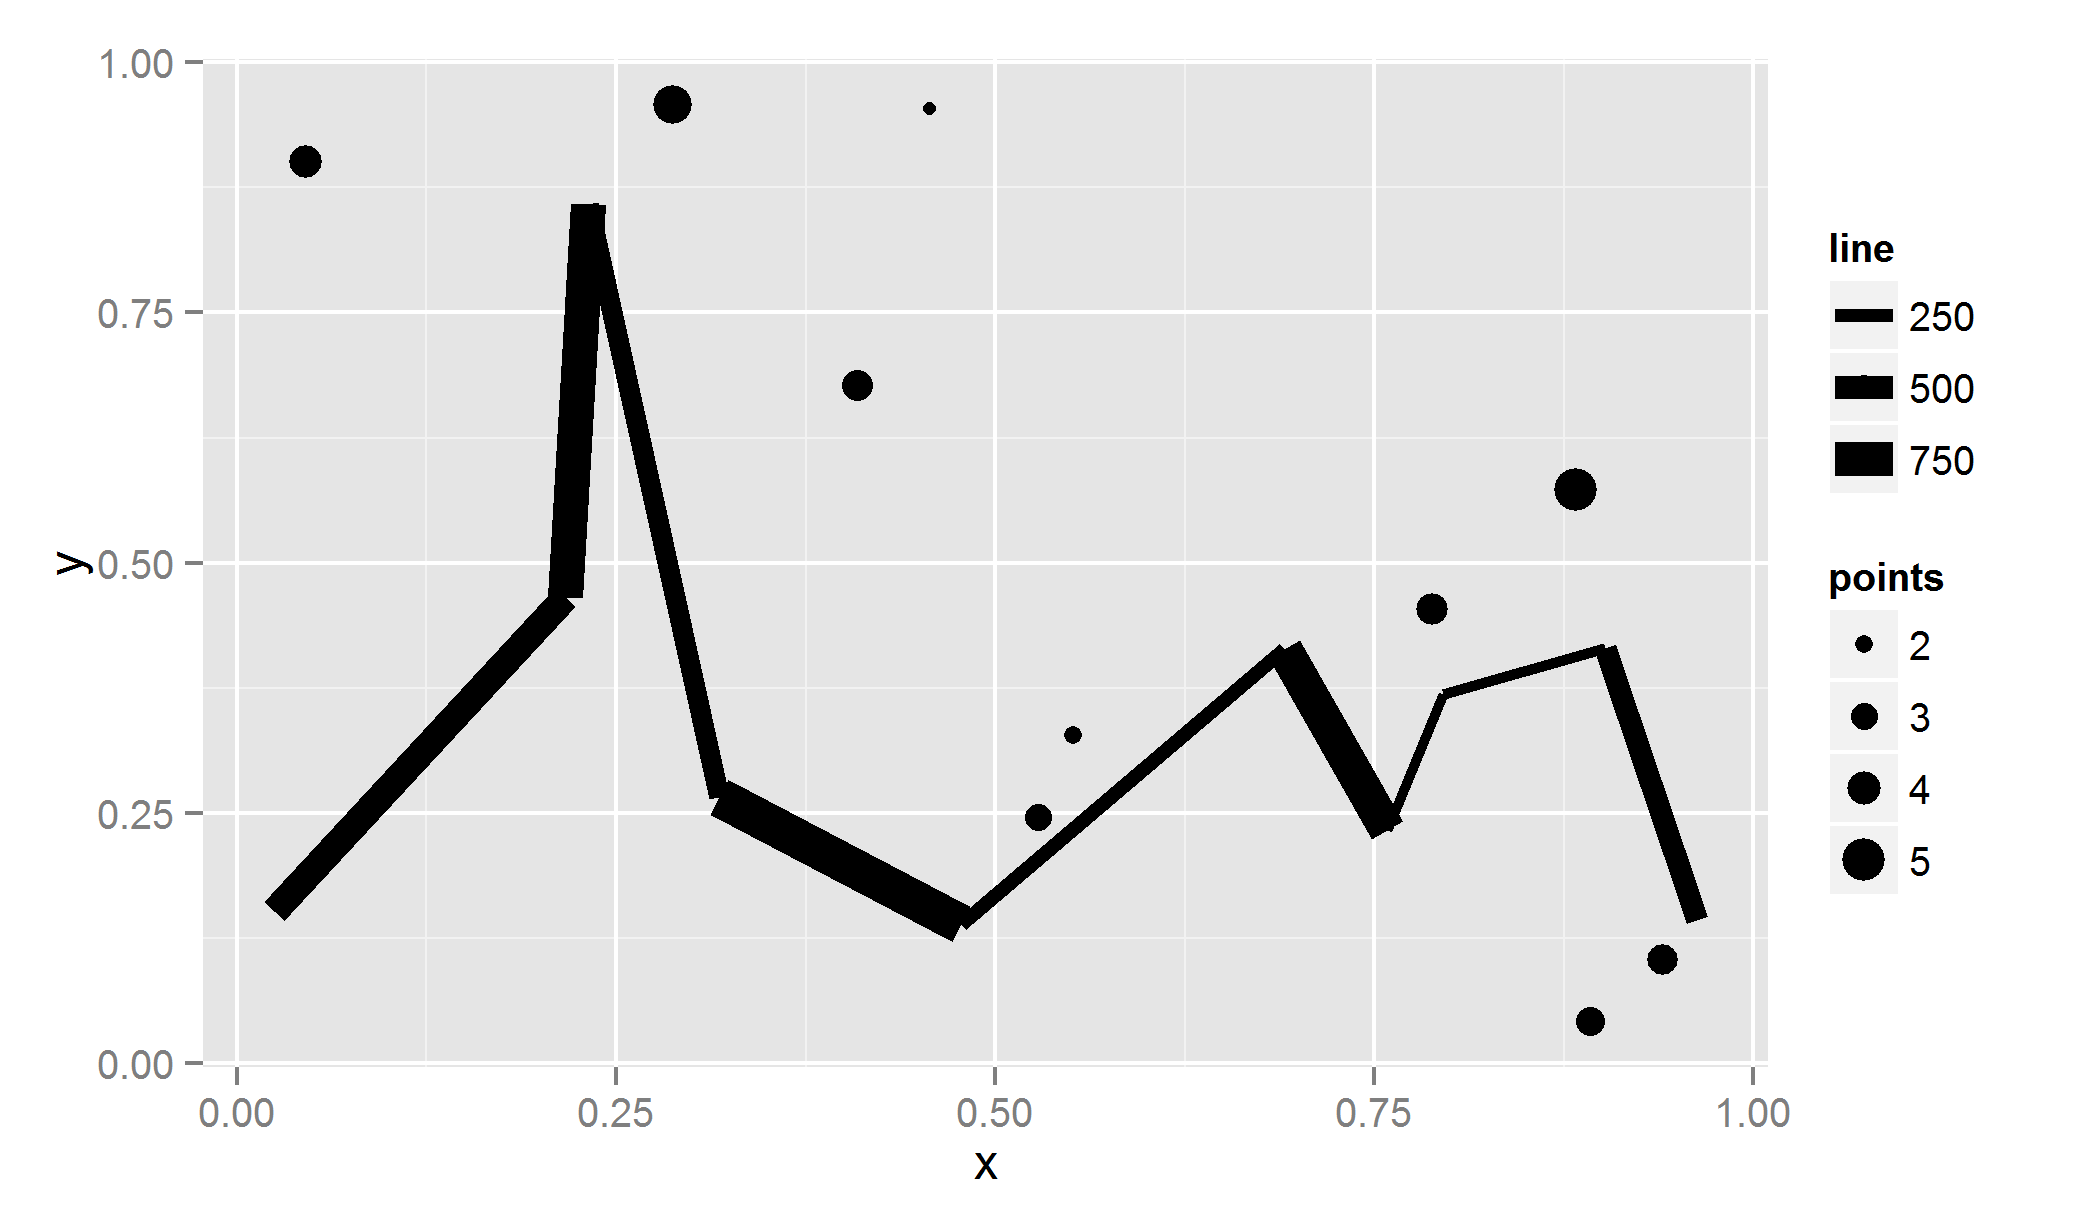
方法2:侵入了另一个美学传说。
MilanoR在这方面有一篇很棒的文章,关注的是颜色而不是尺寸。更多的例子如下: 1) 离散色和2) 颜色梯度。
#Create discrete levels for point sizes (because points will be mapped to fill)
d1$z.bin <- findInterval(d1$z, c(0,2,4,6,8,10), all.inside= TRUE)  #Create bins

#Scale the points to the same size as the lines (points * 100).
#Map points to a dummy aesthetic (fill)
#Hack the fill properties.
ggplot()+  geom_line(aes(x,y,size=z),data=d2) +
  geom_point(aes(x,y, size=z * 100, fill = as.character(z.bin)),data=d1) +
  scale_size("line", range = c(1,5)) +
  scale_fill_manual("points", values = rep(1, 10) ,
                    guide = guide_legend(override.aes =
                              list(colour = "black",
                              size = sort(unique(d1$z.bin)) )))
Stack Overflow用户
发布于 2021-09-16 11:15:21
我是个编程新手,但你可以试试这种方法。正如您所看到的,我的代码使用点和路径。我定义了路径长度的向量。我的线条有1的大小,然后我在向量的后面加上我的点的大小。
size_vec<-c(rep(1, length(unique(Data$Satellite))), 1.4, 4.6, 4.2, 5.5)

plot <- ggplot(data) +
geom_point(aes(x = x_cor, y = y_cor, shape=Type, size=Type)) +
geom_path(aes(x = x_cor, y = y_cor, group = Tour, size=factor(Satellite))) +
scale_size_manual(values = size_vec, guide ='none')页面原文内容由Stack Overflow提供。腾讯云小微IT领域专用引擎提供翻译支持
原文链接:
https://stackoverflow.com/questions/34893760
复制相关文章
相似问题
腾讯云开发者

Copyright © 2013 - 2026 Tencent Cloud. All Rights Reserved. 腾讯云 版权所有
深圳市腾讯计算机系统有限公司 ICP备案/许可证号:粤B2-20090059 ![]() 粤公网安备44030502008569号
粤公网安备44030502008569号
腾讯云计算(北京)有限责任公司 京ICP证150476号 | 京ICP备11018762号