
编辑gtrendsR的图形输出
编辑gtrendsR的图形输出
提问于 2015-12-31 16:26:55
library(gtrendsR)
library(ggplot2)
usr <- "xxxxxx@gmail.com"
psw <- "XXXXX"
gconnect(usr, psw)
climate_trend <- gtrends(c("climate", "cop21", "global warming"), res="week")

plot(climate_trend, main="whatttt", xlab="x")尽管没有收到错误,但使用main=或xlab=等绘图编辑选项不会在绘图输出中创建更改。我曾考虑过将ggplot2与gtrendsR结合使用,但这需要我将list数据转换为我遇到麻烦的data.frame。
我很欣赏使用gtrendsR编辑绘图输出的轴的任何输入。
回答 1
Stack Overflow用户
回答已采纳
发布于 2015-12-31 17:17:14
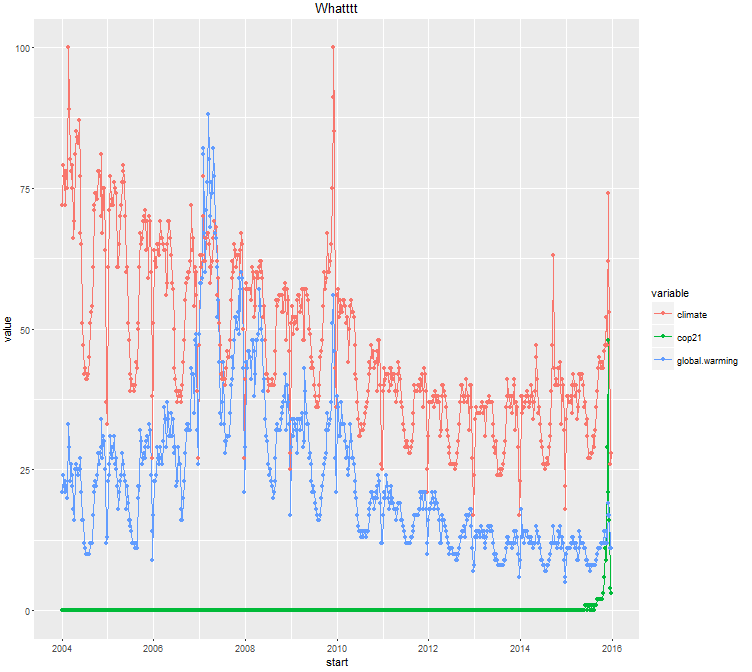
您可能感兴趣的数据框架只是climate_trend$trend元素。下面是我为获得一个ggplot2图所做的工作:
library(gtrendsR)
library(ggplot2)
library(reshape2)

usr <- "xxxx@gmail.com"   # any gmail address and pw will do here
psw <- "xxxxx"
gconnect(usr, psw)
climate_trend <- gtrends(c("climate", "cop21", "global warming"), res="week")

# plot(climate_trend$trend, main="whatttt")

# now for ggplot 2
tdf <- climate_trend$trend
mdf <- melt(tdf,id.vars=c("start","end"))
ggplot(data=mdf,aes(x=start,y=value,color=variable)) +
  geom_line() + geom_point() +
  labs(title="Whatttt")
页面原文内容由Stack Overflow提供。腾讯云小微IT领域专用引擎提供翻译支持
原文链接:
https://stackoverflow.com/questions/34549009
复制相关文章
相似问题
腾讯云开发者

Copyright © 2013 - 2026 Tencent Cloud. All Rights Reserved. 腾讯云 版权所有
深圳市腾讯计算机系统有限公司 ICP备案/许可证号:粤B2-20090059 ![]() 粤公网安备44030502008569号
粤公网安备44030502008569号
腾讯云计算(北京)有限责任公司 京ICP证150476号 | 京ICP备11018762号