
如何通过节点或叶子上的标签来折叠系统发育树中的分支?
我已经为一个蛋白质家族建立了一个系统发育树,它可以被分成不同的组,根据其受体类型或响应类型来分类。树中的节点被标记为受体的类型。
在系统发育树中,我可以看到,属于同一组或同一类型受体的蛋白质聚集在同一分支中。因此,我想折叠这些具有共同标签的分支,将它们按给定的关键字列表分组。
命令应该如下所示:
. -f phylogenetic_tree.newick -l list_of_labels_to_collapse.txt -o collapsed_tree.eps(或pdf)
我的list_of_labels_to_collapse.txt应该是这样的:A,B,C,D
我的纽里克树应该是这样的:(A_1:0.05,A_2:0.03,A_3:0.2,A_4:0.1):0.9,((B_1:0.05,B_2:0.02,B_3:0.04):0.6,(C_1:0.6,C_2:0.08):0.7):0.5,(D_1:0.3,D_2:0.4,D_3:0.5,D_4:0.7,D_5:0.4):1.2)
没有折叠的输出映像如下所示:http://i.stack.imgur.com/pHkoQ.png
输出图像折叠应该如下所示(collapsed_tree.eps):http://i.stack.imgur.com/TLXd0.png
三角形的宽度应表示分支长度,而较高的三角形必须表示分支中的节点数。
我一直在玩R中的"ape“软件包,我绘制了一棵系统发育树,但我仍然想不出如何通过标签中的关键字来折叠树枝:
require("ape")这将加载树:
cat("((A_1:0.05,A_2:0.03,A_3:0.2,A_4:0.1):0.9,(((B_1:0.05,B_2:0.02,B_3:0.04):0.6,(C_1:0.6,C_2:0.08):0.7):0.5,(D_1:0.3,D_2:0.4,D_3:0.5,D_4:0.7,D_5:0.4):1.2):0.5);", file = "ex.tre", sep = "\n")
tree.test <- read.tree("ex.tre")
下面应该是要折叠的代码
这将画出这棵树:
plot(tree.test)回答 4
Stack Overflow用户
发布于 2015-12-21 22:12:21
存储在R中的树已经将提示存储为多个部分。这只是一个用三角形来描绘树的问题。
据我所知,ape中没有这样的功能,但是如果您稍微搞乱绘图功能,就可以完成它。
# Step 1: make edges for descendent nodes invisible in plot:
groups <- c("A", "B", "C", "D")
group_edges <- numeric(0)
for(group in groups){
  group_edges <- c(group_edges,getMRCA(tree.test,tree.test$tip.label[grepl(group, tree.test$tip.label)]))
}
edge.width <- rep(1, nrow(tree.test$edge))
edge.width[tree.test$edge[,1] %in% group_edges ] <- 0


# Step 2: plot the tree with the hidden edges
plot(tree.test, show.tip.label = F, edge.width = edge.width)

# Step 3: add triangles
add_polytomy_triangle <- function(phy, group){
  root <- length(phy$tip.label)+1
  group_node_labels <- phy$tip.label[grepl(group, phy$tip.label)]
  group_nodes <- which(phy$tip.label %in% group_node_labels)
  group_mrca <- getMRCA(phy,group_nodes)

  tip_coord1 <- c(dist.nodes(phy)[root, group_nodes[1]], group_nodes[1])
  tip_coord2 <- c(dist.nodes(phy)[root, group_nodes[1]], group_nodes[length(group_nodes)])
  node_coord <- c(dist.nodes(phy)[root, group_mrca], mean(c(tip_coord1[2], tip_coord2[2])))

  xcoords <- c(tip_coord1[1], tip_coord2[1], node_coord[1])
  ycoords <- c(tip_coord1[2], tip_coord2[2], node_coord[2])
  polygon(xcoords, ycoords)
}
然后,您只需遍历组添加三角形即可。
for(group in groups){
  add_polytomy_triangle(tree.test, group)
}Stack Overflow用户
发布于 2016-01-08 06:53:43
多年来,我也一直在寻找这类工具,与其说是为了崩溃分类组,不如说是为了根据数值支持值来折叠内部节点。
ape包中的di2multi函数可以将节点折叠成多个部分,但它目前只能通过分支长度阈值来实现。下面是一个粗略的调整,它允许由节点支持值阈值折叠(默认阈值= 0.5)。
用你自己的风险,但它对我的根贝叶斯树工作。
di2multi4node <- function (phy, tol = 0.5)
  # Adapted di2multi function from the ape package to plot polytomies
  # based on numeric node support values
  # (di2multi does this based on edge lengths)
  # Needs adjustment for unrooted trees as currently skips the first edge
{
  if (is.null(phy$edge.length))
    stop("the tree has no branch length")
  if (is.na(as.numeric(phy$node.label[2])))
    stop("node labels can't be converted to numeric values")
  if (is.null(phy$node.label))
    stop("the tree has no node labels")
  ind <- which(phy$edge[, 2] > length(phy$tip.label))[as.numeric(phy$node.label[2:length(phy$node.label)]) < tol]
  n <- length(ind)
  if (!n)
    return(phy)
  foo <- function(ancestor, des2del) {
    wh <- which(phy$edge[, 1] == des2del)
    for (k in wh) {
      if (phy$edge[k, 2] %in% node2del)
        foo(ancestor, phy$edge[k, 2])
      else phy$edge[k, 1] <<- ancestor
    }
  }
  node2del <- phy$edge[ind, 2]
  anc <- phy$edge[ind, 1]
  for (i in 1:n) {
    if (anc[i] %in% node2del)
      next
    foo(anc[i], node2del[i])
  }
  phy$edge <- phy$edge[-ind, ]
  phy$edge.length <- phy$edge.length[-ind]
  phy$Nnode <- phy$Nnode - n
  sel <- phy$edge > min(node2del)
  for (i in which(sel)) phy$edge[i] <- phy$edge[i] - sum(node2del <
                                                           phy$edge[i])
  if (!is.null(phy$node.label))
    phy$node.label <- phy$node.label[-(node2del - length(phy$tip.label))]
  phy
}Stack Overflow用户
发布于 2017-07-21 22:44:20
这是我基于phytools::phylo.toBackbone函数的答案,参见http://blog.phytools.org/2013/09/even-more-on-plotting-subtrees-as.html和http://blog.phytools.org/2013/10/finding-edge-lengths-of-all-terminal.html。首先,在代码末尾加载函数。
library(ape)
library(phytools) #phylo.toBackbone
library(phangorn)
cat("((A_1:0.05,E_2:0.03,A_3:0.2,A_4:0.1,A_5:0.1,A_6:0.1,A_7:0.35,A_8:0.4,A_9:01,A_10:0.2):0.9,((((B_1:0.05,B_2:0.05):0.5,B_3:0.02,B_4:0.04):0.6,(C_1:0.6,C_2:0.08):0.7):0.5,(D_1:0.3,D_2:0.4,D_3:0.5,D_4:0.7,D_5:0.4):1.2):0.5);"
, file = "ex.tre", sep = "\n")
phy <- read.tree("ex.tre")
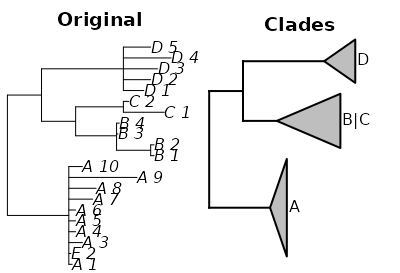
groups <- c("A", "B|C", "D")
backboneoftree<-makebackbone(groups,phy)
# tip.label clade.label N depth
# 1 A_1 A 10 0.2481818
# 2 B_1 B|C 6 0.9400000
# 3 D_1 D 5 0.4600000
{
tryCatch(dev.off(),error=function(e){""})
par(fig=c(0,0.5,0,1), mar = c(0, 0, 2, 0))
plot(phy, main="Original" )
par(fig=c(0.5,1,0,1), oma = c(0, 0, 1.2, 0), xpd=NA, new=T)
plot(backboneoftree)
title(main="Clades")
}
makebackbone <- function(groupings,phy){
listofspecies <- phy$tip.label
listtopreserve <- character()
newedgelengths <- meandistnode<- lengthofclades<- numeric()
for (i in 1:length(groupings)){
bestmrca<-getMRCA(phy,grep(groupings[i], phy$tip.label) )
mrcatips<-phy$tip.label[unlist(phangorn::Descendants(phy,bestmrca, type="tips") )]
listtopreserve[i] <- mrcatips[1]
meandistnode[i] <- mean(dist.nodes(phy)[unlist(lapply(mrcatips,
function(x) grep(x, phy$tip.label) ) ),bestmrca] )
lengthofclades[i] <- length(mrcatips)
provtree <- drop.tip(phy,mrcatips, trim.internal=F, subtree = T)
n3 <- length(provtree$tip.label)
newedgelengths[i] <- setNames(provtree$edge.length[sapply(1:n3,function(x,y)
which(y==x),
y=provtree$edge[,2])],
provtree$tip.label)[provtree$tip.label[grep("tips",provtree$tip.label)] ]
}
newtree <- drop.tip(phy,setdiff(listofspecies,listtopreserve),
trim.internal = T)
n <- length(newtree$tip.label)
newtree$edge.length[sapply(1:n,function(x,y)
which(y==x),
y=newtree$edge[,2])] <- newedgelengths + meandistnode
trans <- data.frame(tip.label=newtree$tip.label,clade.label=groupings,
N=lengthofclades, depth=meandistnode )
rownames(trans) <- NULL
print(trans)
backboneoftree <- phytools::phylo.toBackbone(newtree,trans)
return(backboneoftree)
}
编辑:我还没有试过这一点,但它可能是另一个答案:“脚本和函数转换树的顶端分支,即厚度或三角形,两者的宽度与某些参数(例如,类的物种数)(tip.brches.R)有关”r/index.html
https://stackoverflow.com/questions/34403957
复制相似问题
腾讯云开发者

Copyright © 2013 - 2026 Tencent Cloud. All Rights Reserved. 腾讯云 版权所有
深圳市腾讯计算机系统有限公司 ICP备案/许可证号:粤B2-20090059 ![]() 粤公网安备44030502008569号
粤公网安备44030502008569号
腾讯云计算(北京)有限责任公司 京ICP证150476号 | 京ICP备11018762号